
Page 529 - MARSIUM'21 COMP OF PAPER
P. 529
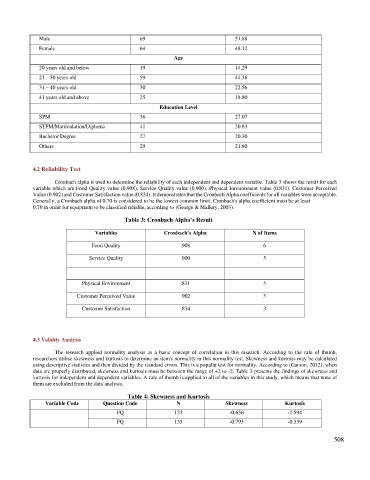
Male                             69                              51.88
              Female                           64                              48.12
                                                           Age
              20 years old and below           19                              14.29
              21 – 30 years old                59                              44.36
              31 – 40 years old                30                              22.56
              41 years old and above           25                              18.80

                                                      Education Level
              SPM                              36                              27.07

              STPM/Matriculation/Diploma       41                              30.83
              Bachelor Degree                  27                              20.30
              Others                           29                              21.80

            4.2 Reliability Test

                   Cronbach alpha is used to determine the reliability of each independent and dependent variable. Table 3 shows the result for each
            variable which are Food Quality value (0.908), Service Quality value (0.900), Physical Environment value (0.831), Customer Perceived
            Value (0.902) and Customer Satisfaction value (0.834). It demonstrates that the Cronbach Alpha coefficients for all variables were acceptable.
            Generally, a Cronbach alpha of 0.70 is considered to be the lowest common limit. Cronbach's alpha coefficient must be at least
            0.70 in order for equipment to be classified reliable, according to (George & Mallery, 2003).

                                          Table 3: Cronbach Alpha’s Result

                                Variables              Cronbach’s Alpha              N of Items

                               Food Quality                  .908                       6

                               Service Quality               .900                       5


                            Physical Environment             .831                       5
                          Customer Perceived Value           .902                       3

                            Customer Satisfaction            .834                       3


            4.3 Validity Analysis

                   The  research  applied  normality  analysis  as  a  basic  concept  of  correlation  in  this  research.  According  to  the  rule  of  thumb,
            researchers utilise skewness and kurtosis to determine an item's normality in this normality test. Skewness and kurtosis may be calculated
            using descriptive statistics and then divided by the standard errors. This is a popular test for normality. According to (Garson, 2012), when
            data are properly distributed, skewness and kurtosis must be between the range of +2 to -2. Table 3 presents the findings of skewness and
            kurtosis for independent and dependent variables. A rule of thumb is applied to all of the variables in this study, which means that none of
            them are excluded from the data analysis.

                                           Table 4: Skewness and Kurtosis
                Variable Code      Question Code           N                Skewness           Kurtosis
                                        FQ                 133               -0.656             -1.594
                                        FQ                 133               -0.795             -0.339


                                                                                                                508