
Page 530 - MARSIUM'21 COMP OF PAPER
P. 530
Food Quality (FQ) FQ 133 -0.921 -0.130
FQ 133 -0.617 -0.567
FQ 133 -0.736 -1.017
FQ 133 -1.118 0.254
SQ 133 -0.206 -1.090
SQ 133 -0.290 -0.822
Service Quality (SQ)
SQ 133 -0.738 -0.412
SQ 133 -0.504 -0.666
SQ 133 -0.542 -1.037
PE 133 -0.635 -0.651
Physical PE 133 -0.600 -0.626
Environment (PE)
PE 133 -0.400 -1.448
PE 133 -0.604 -0.689
PE 133 -0.092 -1.608
Customer Perceived CPV 133 -0.847 -0.816
Value (CPV)
CPV 133 -0.761 -0.564
CPV 133 -0.387 -1.879
Customer CS 133 -0.830 -0.442
Satisfaction (CS)
CS 133 -0.456 -0.752
CS 133 -0.503 -0.910
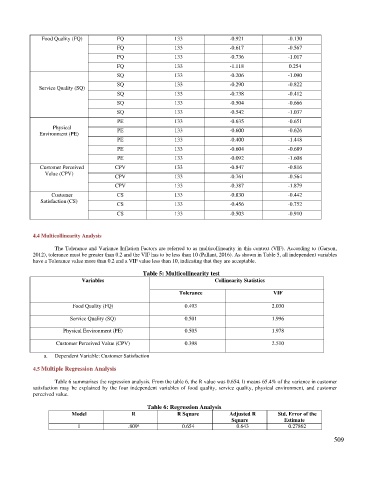
4.4 Multicollinearity Analysis
The Tolerance and Variance Inflation Factors are referred to as multicollinearity in this context (VIF). According to (Garson,
2012), tolerance must be greater than 0.2 and the VIF has to be less than 10 (Pallant, 2016). As shown in Table 5, all independent variables
have a Tolerance value more than 0.2 and a VIF value less than 10, indicating that they are acceptable.
Table 5: Multicollinearity test
Variables Collinearity Statistics
Tolerance VIF
Food Quality (FQ) 0.493 2.030
Service Quality (SQ) 0.501 1.996
Physical Environment (PE) 0.505 1.978
Customer Perceived Value (CPV) 0.398 2.510
a. Dependent Variable: Customer Satisfaction
4.5 Multiple Regression Analysis
Table 6 summarises the regression analysis. From the table 6, the R value was 0.654. It means 65.4% of the variance in customer
satisfaction may be explained by the four independent variables of food quality, service quality, physical environment, and customer
perceived value.
Table 6: Regression Analysis
Model R R Square Adjusted R Std. Error of the
Square Estimate
1 .809 0.654 0.643 0.27862
a
509