Page 590 - MARSIUM'21 COMP OF PAPER
P. 590

569                                        Najihah & Mazilah (2022)

                                                N                                            30
                                                                                                *
                                                Pearson Correlation                         .374
                     Employee Service Quality   Sig. (2-tiled)                              0.042
                                                N                                            30
                                                                                               **
                                                Pearson Correlation                         .522
                    Physical Environment Quality   Sig. (2-tiled)                           0.003
                                                N                                            30
                                                Pearson Correlation                         0.138
                    Customer Perceived Quality   Sig. (2-tiled)                             0.466
                                                N                                            30
                                                Pearson Correlation                         0.344
                           Location             Sig. (2-tiled)                              0.063
                                                N                                            30


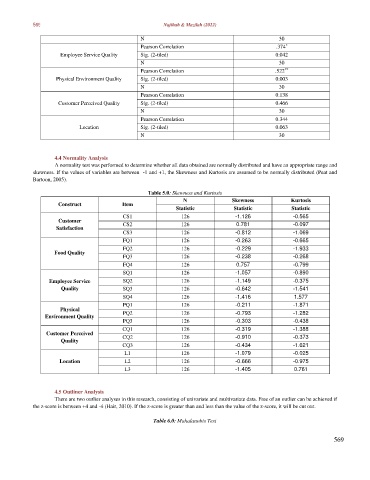
                   4.4 Normality Analysis
                   A normality test was performed to determine whether all data obtained are normally distributed and have an appropriate range and
            skewness. If the values of variables are between  -1 and +1, the Skewness and Kurtosis are assumed to be normally distributed (Peat and
            Bartoon, 2005).

                                                  Table 5.0: Skewness and Kurtosis
                                                              N               Skewness           Kurtosis
                    Construct            Item
                                                           Statistic          Statistic          Statistic
                                          CS1                126               -1.126             -0.565
                    Customer
                    Satisfaction          CS2                126               0.781              -0.097
                                          CS3                126               -0.812             -1.069
                                          FQ1                126               -0.263             -0.665
                                          FQ2                126               -0.229             -1.933
                   Food Quality
                                          FQ3                126               -0.238             -0.268
                                          FQ4                126               0.757              -0.799
                                          SQ1                126               -1.057             -0.890
                 Employee Service         SQ2                126               -1.149             -0.375
                     Quality              SQ3                126               -0.642             -1.541
                                          SQ4                126               -1.416             1.577
                                          PQ1                126               -0.211             -1.871
                     Physical
                Environment Quality       PQ2                126               -0.793             -1.282
                                          PQ3                126               -0.303             -0.438
                                          CQ1                126               -0.319             -1.388
                Customer Perceived        CQ2                126               -0.910             -0.373
                     Quality
                                          CQ3                126               -0.434             -1.621
                                          L1                 126               -1.079             -0.025
                     Location             L2                 126               -0.666             -0.975
                                          L3                 126               -1.405             0.761


                   4.5 Outliner Analysis
                   There are two outlier analyses in this research, consisting of univariate and multivariate data. Free of an outlier can be achieved if
            the z-score is between +4 and -4 (Hair, 2010). If the z-score is greater than and less than the value of the z-score, it will be cut out.

                                                    Table 6.0: Mahalanobis Test


                                                                                                               569
   585   586   587   588   589   590   591   592   593   594   595