
Page 589 - MARSIUM'21 COMP OF PAPER
P. 589
568 Najihah & Mazilah (2022)
questions. = 0.30 to 0.49 or r = -0.30 to -0.49) and
strong r = 0.50 to 1.00 or r = -0.50 to -
1.00
Univariate Analysis In order to avoid outliers on each answer MahalaNobis D Square Test -
in the item questionnaire, it is necessary to standardized z score values must not be
measure the range and variance of the lower than -4 or greater than +4
dispersion in the collected data.
Multivariate Analysis Identifying and evaluating the MahalaNobis D Square Test -
completeness and correctness of the data standardized z score values must not be
while also examining the relationship lower than -4 or greater than +4
between the other variables
Multicollinearity Analysis It is necessary to determine whether or not Tolerance more than 0.2; VIF below than
there is a predictor with a high connection 10
between the variables.
Multiple Regression Analysis To determine the relationship between the p-value is less than 0.05, is significant
independent variable and the dependent
variable, as well as the importance of the
independent variable when compared to
other variables.
■ 4.0 RESULT AND DISCUSSION
4.1 Demographic Characteristics
This study collected the respondent demographics based on age, gender, monthly income and marital status. The demographic
characteristics were examined in terms of percentage and frequency. The majority of the respondents are female. The demographic
characteristics contained involved various respondents’ gender, age (range from below 20 to 50 years old and majority is 21 to 30 years old),
monthly income (range from less than RM 1000 to RM4000 with the majority in Rm1001 to RM 2000 per month) and marital status (range
in married and single with majority in the single status).
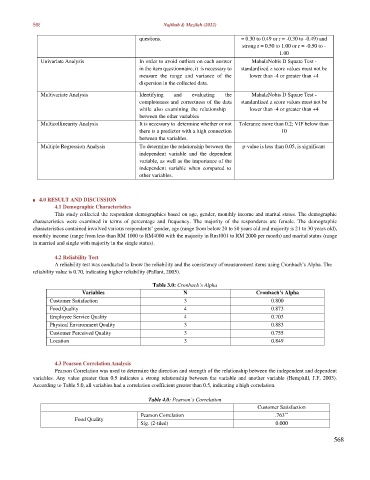
4.2 Reliability Test
A reliability test was conducted to know the reliability and the consistency of measurement items using Cronbach’s Alpha. The
reliability value is 0.70, indicating higher reliability (Pallant, 2005).
Table 3.0: Cronbach’s Alpha
Variables N Cronbach’s Alpha
Customer Satisfaction 3 0.800
Food Quality 4 0.873
Employee Service Quality 4 0.703
Physical Environment Quality 3 0.883
Customer Perceived Quality 3 0.755
Location 3 0.849
4.3 Pearson Correlation Analysis
Pearson Correlation was used to determine the direction and strength of the relationship between the independent and dependent
variables. Any value greater than 0.5 indicates a strong relationship between the variable and another variable (Hemphill, J.F, 2003).
According to Table 5.0, all variables had a correlation coefficient greater than 0.5, indicating a high correlation.
Table 4.0: Pearson’s Correlation
Customer Satisfaction
**
Pearson Correlation .763
Food Quality
Sig. (2-tiled) 0.000
568