
Page 591 - MARSIUM'21 COMP OF PAPER
P. 591
570 Najihah & Mazilah (2022)
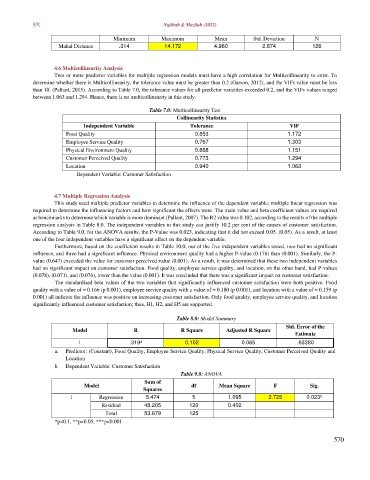
Minimum Maximum Mean Std. Deviation N
Mahal Distance .314 14.172 4.960 2.874 126
4.6 Multicollinearity Analysis
Two or more predictor variables for multiple regression models must have a high correlation for Multicollinearity to exist. To
determine whether there is Multicollinearity, the tolerance value must be greater than 0.2 (Garson, 2012), and the VIFs value must be less
than 10. (Pallant, 2015). According to Table 7.0, the tolerance values for all predictor variables exceeded 0.2, and the VIFs values ranged
between 1.063 and 1.294. Hence, there is no multicollinearity in this study.
Table 7.0: Multicollinearity Test
Collinearity Statistics
Independent Variable Tolerance VIF
Food Quality 0.853 1.172
Employee Service Quality 0.767 1.303
Physical Environment Quality 0.868 1.151
Customer Perceived Quality 0.773 1.294
Location 0.940 1.063
Dependent Variable: Customer Satisfaction
4.7 Multiple Regression Analysis
This study used multiple predictor variables to determine the influence of the dependent variable; multiple linear regression was
required to determine the influencing factors and how significant the effects were. The main value and beta coefficient values are required
as benchmarks to determine which variable is more dominant (Pallant, 2007). The R2 value was 0.102, according to the results of the multiple
regression analysis in Table 8.0. The independent variables in this study can justify 10.2 per cent of the causes of customer satisfaction.
According to Table 9.0, for the ANOVA results, the P-Value was 0.023, indicating that it did not exceed 0.05. (0.05). As a result, at least
one of the four independent variables have a significant effect on the dependent variable.
Furthermore, based on the coefficient results in Table 10.0, out of the five independent variables tested, two had no significant
influence, and three had a significant influence. Physical environment quality had a higher P-value (0.176) than (0.001). Similarly, the P-
value (0.647) exceeded the value for customer perceived value (0.001). As a result, it was determined that these two independent variables
had no significant impact on customer satisfaction. Food quality, employee service quality, and location, on the other hand, had P-values
(0.078), (0.071), and (0.076), lower than the value (0.001). It was concluded that there was a significant impact on customer satisfaction.
The standardised beta values of the two variables that significantly influenced customer satisfaction were both positive. Food
quality with a value of = 0.166 (p 0.001), employee service quality with a value of = 0.180 (p 0.001), and location with a value of = 0.159 (p
0.001) all indicate the influence was positive on increasing customer satisfaction. Only food quality, employee service quality, and location
significantly influenced customer satisfaction; thus, H1, H2, and H5 are supported.
Table 8.0: Model Summary
Std. Error of the
Model R R Square Adjusted R Square
Estimate
1 .319 0.102 0.065 .63380
a
a. Predictor: (Constant), Food Quality, Employee Service Quality, Physical Service Quality, Customer Perceived Quality and
Location
b. Dependent Variable: Customer Satisfaction
Table 9.0: ANOVA
Sum of
Model df Mean Square F Sig.
Squares
b
1 Regression 5.474 5 1.095 2.725 0.023
Residual 48.205 120 0.402
Total 53.679 125
*p<0.1, **p<0.05, ***p<0.001
570