
Page 588 - MARSIUM'21 COMP OF PAPER
P. 588
567 Najihah & Mazilah (2022)
3.2 Population and Sampling
The respondents to this survey are consumers of Nasi Lemak Hao. Furthermore, participants in this study must be made a previous
purchase from Nasi Lemak Hao to be eligible for participation. This is because the researcher was only interested in Nasi Lemak Hao client
satisfaction limiting its scope. The non-probability sampling technique, also known as purposive sampling, was selected and employed by
the researchers for this study. The low cost per completed interview, which is far cheaper than even low-cost probabilistic sampling
approaches such as mail surveys or telephone surveys, makes non-probability sampling the favoured method of choice for researchers over
probability sampling (Brick, 2014).
First, after answering a question to confirm that the respondent is indeed a customer of Nasi Lemak Hao, the respondent would
be able to proceed with the survey. Cohen's table was used as a tool to calculate the sample size. The purpose of the study is to determine
an acceptable sampling size to optimise rather than maximise sampling effort while working within the restrictions of time and money (Lee
Chuan, 2006). Increasing sample efforts would make it easier to avoid data storage situations, resulting in inconclusive conclusions.
According to Cohen's table, a sample size of 126 is required for five independent variables to be statistically significant. Other considerations,
including respondents who did not return the questionnaire form and other constraints, have led to the researcher including just approximately
10% of those who replied in this study. The significance of the study was determined via multiple regression analysis and the F test of
multiple R2, with a p-value of less than 0.01.
3.3 Research Instrument
In this study, three-part structured questionnaires were used, with each section containing three questions. The first section contains
information on the prospective respondent's demographic background. Sixteen components are covered in the second section, including the
customer's experience with the meal quality, the employee's service quality, the physical environment quality, the customer's perceived
quality, and the location. Finally, in the third section, respondents were provided with a series of questions about client satisfaction. A
nominal scale is used in the first section, and in the second and third sections, a Likert scale was used. Respondents were asked to fill out a
Google Form, which was used to gather information. The researcher provided the Google form to the restaurant's owner, Nasi Lemak Hao,
who then uploaded it to its WhatsApp status. According to the researcher, WhatsApp was used among other sites since it is easier to reach
out to customers compared to other open platforms.
The researcher conducted preliminary testing prior to disseminating the survey questionnaire through a pilot study and pre-test.
The current study conducted an academic expert validity to validate the items measurements. The expert was chosen from the field of
Marketing and Management (Dr Grace Thoo Ai Chin – UTM). The recommended pilot sample size of 30 individuals defaulted for the pre-
testing phase of the study (Perneger et al., 2015). Immediately after completing the pre-testing phase, the researcher conducted the study.
The goal is to evaluate whether the questions were valid based on their substance and face validity and the usability (including ease of access
and navigation) utilised to administer the questionnaire (Fraser et al., 2018).
3.4 Data Analysis
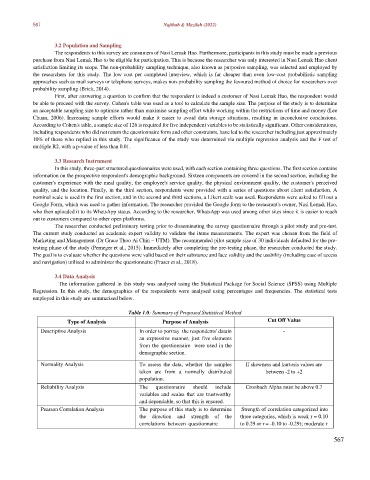
The information gathered in this study was analysed using the Statistical Package for Social Science (SPSS) using Multiple
Regression. In this study, the demographics of the respondents were analysed using percentages and frequencies. The statistical tests
employed in this study are summarised below.
Table 1.0: Summary of Proposed Statistical Method
Type of Analysis Purpose of Analysis Cut Off Value
Descriptive Analysis In order to portray the respondents' data in -
an expressive manner, just five elements
from the questionnaire were used in the
demographic section.
Normality Analysis To assess the data, whether the samples If skewness and kurtosis values are
taken are from a normally distributed between -2 to +2
population.
Reliability Analysis The questionnaire should include Cronbach Alpha must be above 0.7
variables and scales that are trustworthy
and dependable, so that this is ensured.
Pearson Correlation Analysis The purpose of this study is to determine Strength of correlation categorized into
the direction and strength of the three categories, which is weak r = 0.10
correlations between questionnaire to 0.29 or r = -0.10 to -0.29); moderate r
567