
Page 592 - MARSIUM'21 COMP OF PAPER
P. 592
571 Najihah & Mazilah (2022)
a. Dependent Variable: Customer Satisfaction
c. b. Predictors: (Constant), Food Quality, Employee Service Quality, Physical Service Quality, Customer Perceived Quality
and Location
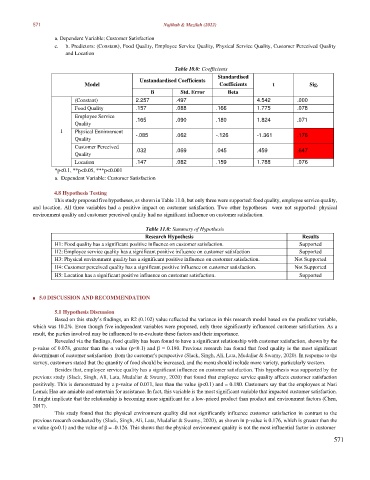
Table 10.0: Coefficients
Unstandardised Coefficients Standardised
Model Coefficients t Sig.
B Std. Error Beta
(Constant) 2.257 .497 4.542 .000
Food Quality .157 .088 .166 1.775 .078
Employee Service
Quality .165 .090 .180 1.824 .071
1 Physical Environment
Quality -.085 .062 -.126 -1.361 .176
Customer Perceived .032 .069 .045 .459 .647
Quality
Location .147 .082 .159 1.788 .076
*p<0.1, **p<0.05, ***p<0.001
a. Dependent Variable: Customer Satisfaction
4.8 Hypothesis Testing
This study proposed five hypotheses, as shown in Table 11.0, but only three were supported: food quality, employee service quality,
and location. All three variables had a positive impact on customer satisfaction. Two other hypotheses were not supported: physical
environment quality and customer perceived quality had no significant influence on customer satisfaction.
Table 11.0: Summary of Hypothesis
Research Hypothesis Results
H1: Food quality has a significant positive influence on customer satisfaction. Supported
H2: Employee service quality has a significant positive influence on customer satisfaction Supported
H3: Physical environment quality has a significant positive influence on customer satisfaction. Not Supported
H4: Customer perceived quality has a significant positive influence on customer satisfaction. Not Supported
H5: Location has a significant positive influence on customer satisfaction. Supported
■ 5.0 DISCUSSION AND RECOMMENDATION
5.1 Hypothesis Discussion
Based on this study’s findings, an R2 (0.102) value reflected the variance in this research model based on the predictor variable,
which was 10.2%. Even though five independent variables were proposed, only three significantly influenced customer satisfaction. As a
result, the parties involved may be influenced to re-evaluate these factors and their importance.
Revealed via the findings, food quality has been found to have a significant relationship with customer satisfaction, shown by the
p-value of 0.078, greater than the α value (p<0.1) and β = 0.180. Previous research has found that food quality is the most significant
determinant of customer satisfaction from the customer's perspective (Slack, Singh, Ali, Lata, Mudaliar & Swamy, 2020). In response to the
survey, customers stated that the quantity of food should be increased, and the menu should include more variety, particularly western.
Besides that, employee service quality has a significant influence on customer satisfaction. This hypothesis was supported by the
previous study (Slack, Singh, Ali, Lata, Mudaliar & Swamy, 2020) that found that employee service quality affects customer satisfaction
positively. This is demonstrated by a p-value of 0.071, less than the value (p<0.1) and = 0.180. Customers say that the employees at Nasi
Lemak Hao are amiable and entertain for assistance. In fact, this variable is the most significant variable that impacted customer satisfaction.
It might implicate that the relationship is becoming more significant for a low-priced product than product and environment factors (Chen,
2017).
This study found that the physical environment quality did not significantly influence customer satisfaction in contrast to the
previous research conducted by (Slack, Singh, Ali, Lata, Mudaliar & Swamy, 2020), as shown in p-value is 0.176, which is greater than the
α value (p>0.1) and the value of β = -0.126. This shows that the physical environment quality is not the most influential factor in customer
571