
Page 662 - MARSIUM'21 COMP OF PAPER
P. 662
641 Syamimi (2022)
3.5 Data Analysis
A statistical analysis using the Scientific Social Statistical Software (SPSS) was conducted in this study. Several statistics are run
using SPSS software, including descriptive analysis, reliability tests, normality tests, independent sample t-tests, and multiple
regressions. For the purpose of testing the hypotheses, SPSS was used to distribute 133 questionnaires to Instagram users. Analysis
of data is essential because it provides a visual representation of various ideas, hypotheses, frameworks, and methods used to
conduct the study. To determine whether the measurements were accurate, a reliability test was conducted. If a variable is stable,
the Alpha value needs to exceed 0.7. Then, we conducted a normality test. In general, skewness and kurtosis in a normal data
distribution should lie between -2 and +2. If the coefficient of correlation is close to 1, there is a strong correlation between the two
variables. Additionally, the significance of regression in this study is defined by a P-value of less than 0.05.
4.0 DATA ANALYSIS AND FINDINGS
4.1 Descriptive Analysis
Nowadays, Users not really into pharmaceutical product. Important content posting may lead to customer engage on the product.
In addition, in growth of digital media has made it possible to seller create and distribute content over the internet for a variety of
purposes.
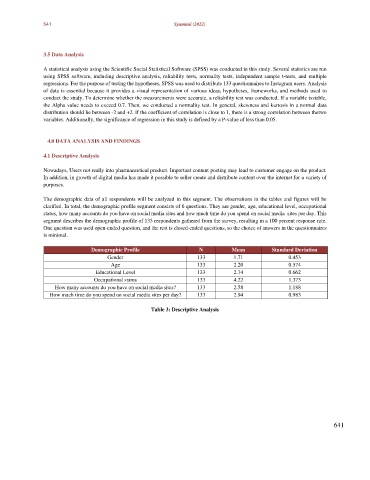
The demographic data of all respondents will be analyzed in this segment. The observations in the tables and figures will be
clarified. In total, the demographic profile segment consists of 6 questions. They are gender, age, educational level, occupational
status, how many accounts do you have on social media sites and how much time do you spend on social media sites per day. This
segment describes the demographic profile of 133 respondents gathered from the survey, resulting in a 100 percent response rate.
One question was used open-ended question, and the rest is closed-ended questions, so the choice of answers in the questionnaires
is minimal.
Demographic Profile N Mean Standard Deviation
Gender 133 1.71 0.453
Age 133 2.20 0.574
Educational Level 133 2.74 0.662
Occupational status 133 4.22 1.373
How many accounts do you have on social media sites? 133 2.58 1.188
How much time do you spend on social media sites per day? 133 2.94 0.983
Table 3: Descriptive Analysis
641