
Page 664 - MARSIUM'21 COMP OF PAPER
P. 664
643 Syamimi (2022)
Meanwhile, among Instagram users, using more than 1 account is common because there is no significant difference owned by
the respondents. Based on the results shown, there are 44 respondents (33.1%) who have more than 3 accounts, while 34 (25.6%)
have 2 accounts. While 33 respondents have 1 account. Finally, the least is the respondents who use 3 accounts only 22 respondents
in this survey. The majority of respondents spent more than 3 hours on Instagram, and 50 (37.6%) respondents were in the sample.
In contrast, only 10 (23.0%) respondents spend on Instagram. In addition, there are 38 (28.6%) respondents spend time from 1 to
2 hours, and 35 (26.3%) respondents spend time from 2 to 3 hours. This shows that the majority of respondents like to use
Instagram.
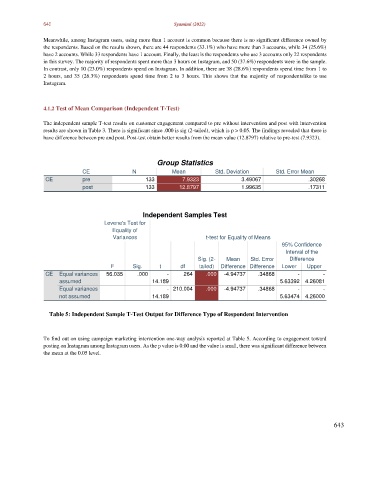
4.1.2 Test of Mean Comparison (Independent T-Test)
The independent sample T-test results on customer engagement compared to pre without intervention and post with intervention
results are shown in Table 3. There is significant since .000 is sig (2-tailed), which is p > 0.05. The findings revealed that there is
have difference between pre and post. Post-test obtain better results from the mean value (12.8797) relative to pre-test (7.9323).
Group Statistics
CE N Mean Std. Deviation Std. Error Mean
CE pre 133 7.9323 3.49067 .30268
post 133 12.8797 1.99635 .17311
Independent Samples Test
Levene's Test for
Equality of
Variances t-test for Equality of Means
95% Confidence
Interval of the
Sig. (2- Mean Std. Error Difference
F Sig. t df tailed) Difference Difference Lower Upper
CE Equal variances 56.035 .000 - 264 .000 -4.94737 .34868 - -
assumed 14.189 5.63392 4.26081
Equal variances - 210.004 .000 -4.94737 .34868 - -
not assumed 14.189 5.63474 4.26000
Table 5: Independent Sample T-Test Output for Difference Type of Respondent Intervention
To find out on using campaign marketing intervention one-way analysis reported at Table 5. According to engagement toward
posting on Instagram among Instagram users. As the p value is 0.00 and the value is small, there was significant difference between
the mean at the 0.05 level.
643