
Page 665 - MARSIUM'21 COMP OF PAPER
P. 665
644 Syamimi (2022)
4.2 Scale Measurement
4.2.1 Reliability Test
Table 6 below displays all variables that were checked using Cronbach's alpha to find out the stability and accuracy. Making sure
that the scales and variables used are accurate is compulsory. By Cronbach alpha, the reliability is calculated. The Cronbach
alpha value in the study situation should be above the reliability coefficient of 0.70 to be acknowledged (Jilcha Sileyew, 2019).
As shown by the Cronbach Alpha values ranging from 0.846 to 0.870 for all variables, the Cronbach Alpha value was shown to
be accurate for all items within the range value of 0.7 and more which is reliable.
Variables N of Items CRONBACH'S ALPHAA Relationship
IV 1 Interactivity 5 0.870 Excellent
IV 2 Consistency 5 0.846 Excellent
IV 3 Content type 5 0.847 Excellent
Table 6: Reliability Test
4.3 Inferential Analysis
4.3.1 Multiple Linear Regressions (MLR)
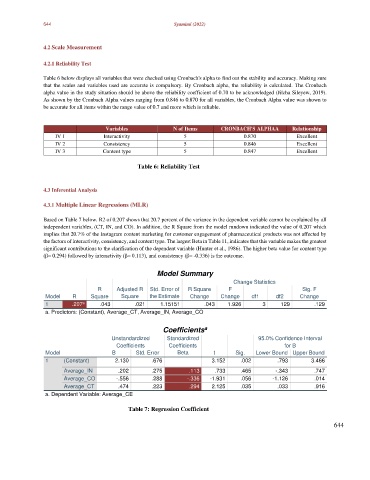
Based on Table 7 below. R2 of 0.207 shows that 20.7 percent of the variance in the dependent variable cannot be explained by all
independent variables, (CT, IN, and CO). In addition, the R Square from the model rundown indicated the value of 0.207 which
implies that 20.7% of the Instagram content marketing for customer engagement of pharmaceutical products was not affected by
the factors of interactivity, consistency, and content type. The largest Beta in Table 11, indicates that this variable makes the greatest
significant contributions to the clarification of the dependent variable (Hunter et al., 1986). The higher beta value for content type
(β= 0.294) followed by interactivity (β= 0.113), and consistency (β= -0.336) is the outcome.
Model Summary
Change Statistics
R Adjusted R Std. Error of R Square F Sig. F
Model R Square Square the Estimate Change Change df1 df2 Change
a
1 .207 .043 .021 1.15151 .043 1.926 3 129 .129
a. Predictors: (Constant), Average_CT, Average_IN, Average_CO
a
Coefficients
Unstandardized Standardized 95.0% Confidence Interval
Coefficients Coefficients for B
Model B Std. Error Beta t Sig. Lower Bound Upper Bound
1 (Constant) 2.130 .676 3.152 .002 .793 3.466
Average_IN .202 .275 .113 .733 .465 -.343 .747
Average_CO -.556 .288 -.336 -1.931 .056 -1.126 .014
Average_CT .474 .223 .294 2.125 .035 .033 .916
a. Dependent Variable: Average_CE
Table 7: Regression Coefficient
644