
Page 663 - MARSIUM'21 COMP OF PAPER
P. 663
642 Syamimi (2022)
4.1.1 Respondent Background
Cumulative
Demographic Profile Characteristic Frequency Percent Valid Percent
Percent
Male 38 28.6 28.6 28.6
Gender
Female 95 71.4 71.4 100.0
17 years old and below 0 0 0 0
18 – 25 years old 114 85.7 85.7 85.7
Age 26 – 30 years old 14 10.5 10.5 96.2
31 – 40 years old 2 1.5 1.5 97.7
Over 40 years old 3 2.3 2.3 100.0
SPM 7 5.3 5.3 5.3
STPM / Diploma / A-Level 27 20.3 20.3 25.6
Bachelor 95 71.4 71.4 97.0
Educational Level
Master / MBA 3 2.3 2.3 99.2
PhD / DBA 0 0 0 0
Other 1 0.8 0.8 100.0
Self-employed 7 5.3 5.3 5.3
Employed 22 16.5 16.5 21.8
Occupational status Unemployed 5 3.8 3.8 25.6
Retired 0 0 0 0
Full-time student 99 74.4 74.4 100.0
1 account 33 24.8 24.8 24.8
How many accounts do 2 accounts 34 25.6 25.6 50.4
you have on social 3 accounts 22 16.5 16.5 66.9
media sites?
More than 3 accounts 44 33.1 33.1 100.0
Less than 30 minutes 10 7.5 7.5 7.5
How much tome do you 1 – 2 hours 38 28.6 28.6 36.1
spend on social media 2 – 3 hours 35 26.3 26.3 62.4
sites per day?
More than 3 hours 50 37.6 37.6 100.0
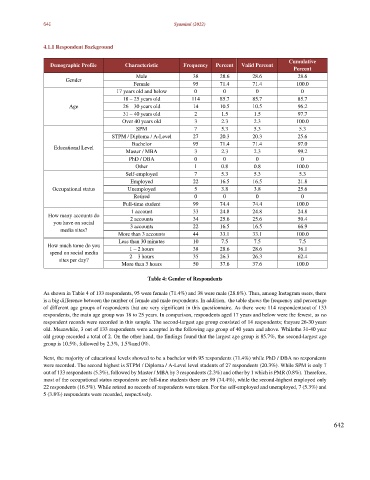
Table 4: Gender of Respondents
As shown in Table 4 of 133 respondents, 95 were female (71.4%) and 38 were male (28.6%). Thus, among Instagram users, there
is a big difference between the number of female and male respondents. In addition, the table shows the frequency and percentage
of different age groups of respondents that are very significant in this questionnaire. As there were 114 respondents out of 133
respondents, the main age group was 18 to 25 years. In comparison, respondents aged 17 years and below were the fewest, as no
respondent records were recorded in this sample. The second-largest age group consisted of 14 respondents; they are 26-30 years
old. Meanwhile, 3 out of 133 respondents were accepted in the following age group of 40 years and above. While the 31-40 year
old group recorded a total of 2. On the other hand, the findings found that the largest age group is 85.7%, the second-largest age
group is 10.5%, followed by 2.3%, 1.5%and 0%.
Next, the majority of educational levels showed to be a bachelor with 95 respondents (71.4%) while PhD / DBA no respondents
were recorded. The second highest is STPM / Diploma / A-Level level students of 27 respondents (20.3%). While SPM is only 7
out of 133 respondents (5.3%), followed by Master / MBA by 3 respondents (2.3%) and other by 1 which is PMR (0.8%). Therefore,
most of the occupational status respondents are full-time students there are 99 (74.4%), while the second-highest employed only
22 respondents (16.5%). While retired no records of respondents were taken. For the self-employed and unemployed, 7 (5.3%) and
5 (3.8%) respondents were recorded, respectively.
642