
Page 758 - MARSIUM'21 COMP OF PAPER
P. 758
737 Alya (2022)
market share and attracting loyal customers. Customers that are loyal to a brand are more likely to repurchase and suggest it to others.
Customers who are loyal to a brand will pay more for it than for similar products (Erics, et al., 2012). Previous research has shown that
customers who are loyal to a company for a long time make repeat purchases, resulting in profitability and growth (Molla & Licker, 2001
cited in Mirabi et al., 2015). Previous research indicates that high levels of brand loyalty lead to the purchase of the same brand on an
ongoing basis (Lee et al. 2009 cited in (Brzozowska-woś, 2013).
H4: Brand loyalty has a significant effect on customer’ purchase intention
2.2 RESEARCH FRAMEWORK MODEL
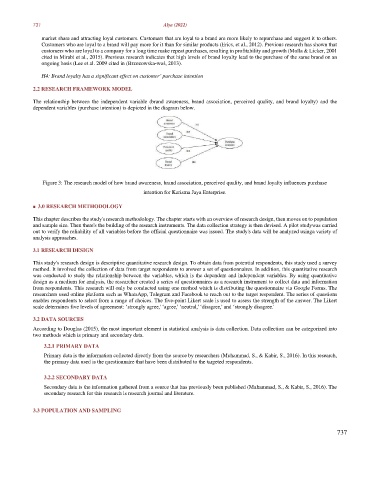
The relationship between the independent variable (brand awareness, brand association, perceived quality, and brand loyalty) and the
dependent variables (purchase intention) is depicted in the diagram below.
Figure 3: The research model of how brand awareness, brand association, perceived quality, and brand loyalty influences purchase
intention for Karisma Jaya Enterprise.
■ 3.0 RESEARCH METHODOLOGY
This chapter describes the study's research methodology. The chapter starts with an overview of research design, then moves on to population
and sample size. Then there's the building of the research instruments. The data collection strategy is then devised. A pilot study was carried
out to verify the reliability of all variables before the official questionnaire was issued. The study's data will be analyzed using a variety of
analysis approaches.
3.1 RESEARCH DESIGN
This study's research design is descriptive quantitative research design. To obtain data from potential respondents, this study used a survey
method. It involved the collection of data from target respondents to answer a set of questionnaires. In addition, this quantitative research
was conducted to study the relationship between the variables, which is the dependent and independent variables. By using quantitative
design as a medium for analysis, the researcher created a series of questionnaires as a research instrument to collect data and information
from respondents. This research will only be conducted using one method which is distributing the questionnaire via Google Forms. The
researchers used online platform such as WhatsApp, Telegram and Facebook to reach out to the target respondent. The series of questions
enables respondents to select from a range of choices. The five-point Likert scale is used to assess the strength of the answer. The Likert
scale determines five levels of agreement: ‘strongly agree,' ‘agree,' ‘neutral,' ‘disagree,' and ‘strongly disagree.'
3.2 DATA SOURCES
According to Douglas (2015), the most important element in statistical analysis is data collection. Data collection can be categorized into
two methods which is primary and secondary data.
3.2.1 PRIMARY DATA
Primary data is the information collected directly from the source by researchers (Muhammad, S., & Kabir, S., 2016). In this research,
the primary data used is the questionnaire that have been distributed to the targeted respondents.
3.2.2 SECONDARY DATA
Secondary data is the information gathered from a source that has previously been published (Muhammad, S., & Kabir, S., 2016). The
secondary research for this research is research journal and literature.
3.3 POPULATION AND SAMPLING
737