
Page 761 - MARSIUM'21 COMP OF PAPER
P. 761
740 Alya (2022)
Questionnaires were distributed through online method by google form. A total of 120 questionnaires were answered by respondents from
12 November 2021 to 23 December 2021. All 120-questionnaire answered by respondent were accepted. The study yielded 100% of response
rate. A screening question on whether respondents had ever used Kasih Bonda Mee Kuning was asked before they answered the question.
Further explanation was given to the respondents when they had questions about the questionnaire items.
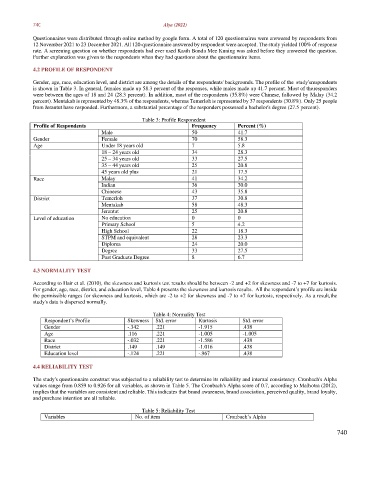
4.2 PROFILE OF RESPONDENT
Gender, age, race, education level, and district are among the details of the respondents' backgrounds. The profile of the study's respondents
is shown in Table 3. In general, females made up 58.3 percent of the responses, while males made up 41.7 percent. Most of the responders
were between the ages of 18 and 24 (28.3 percent). In addition, most of the respondents (35.8%) were Chinese, followed by Malay (34.2
percent). Mentakab is represented by 48.3% of the respondents, whereas Temerloh is represented by 37 respondents (30.8%). Only 25 people
from Jerantut have responded. Furthermore, a substantial percentage of the responders possessed a bachelor's degree (27.5 percent).
Table 3: Profile Responedent
Profile of Respondents Frequency Percent (%)
Male 50 41.7
Gender Female 70 58.3
Age Under 18 years old 7 5.8
18 – 24 years old 34 28.3
25 – 34 years old 33 27.5
35 – 44 years old 25 20.8
45 years old plus 21 17.5
Race Malay 41 34.2
Indian 36 30.0
Chineese 43 35.8
District Temerloh 37 30.8
Mentakab 58 48.3
Jerantut 25 20.8
Level of education No education 0 0
Primary School 5 4.2
High School 22 18.3
STPM and equivalent 28 23.3
Diploma 24 20.0
Degree 33 27.5
Post Graduate Degree 8 6.7
4.3 NORMALITY TEST
According to Hair et al. (2010), the skewness and kurtosis test results should be between -2 and +2 for skewness and -7 to +7 for kurtosis.
For gender, age, race, district, and education level, Table 4 presents the skewness and kurtosis results. All the respondent’s profile are inside
the permissible ranges for skewness and kurtosis, which are -2 to +2 for skewness and -7 to +7 for kurtosis, respectively. As a result, the
study's data is dispersed normally.
Table 4: Normality Test
Respondent’s Profile Skewness Std. error Kurtosis Std. error
Gender -.342 .221 -1.915 .438
Age .116 .221 -1.005 -1.005
Race -.032 .221 -1.586 .438
District .149 .149 -1.016 .438
Education level -.124 .221 -.967 .438
4.4 RELIABILITY TEST
The study's questionnaire construct was subjected to a reliability test to determine its reliability and internal consistency. Cronbach's Alpha
values range from 0.859 to 0.926 for all variables, as shown in Table 5. The Cronbach's Alpha score of 0.7, according to Malhotra (2012),
implies that the variables are consistent and reliable. This indicates that brand awareness, brand association, perceived quality, brand loyalty,
and purchase intention are all reliable.
Table 5: Reliability Test
Variables No. of item Cronbach’s Alpha
740