
Page 762 - MARSIUM'21 COMP OF PAPER
P. 762
741 Alya (2022)
Brand Awareness 5 .892
Brand Association 3 .882
Perceived Quality 4 .861
Brand Loyalty 5 .926
Purchase Intention 3 .859
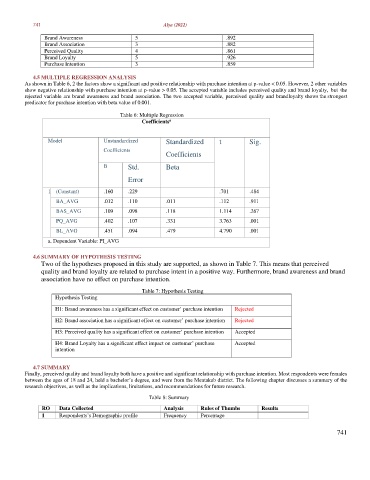
4.5 MULTIPLE REGRESSION ANALYSIS
As shown in Table 6, 2 the factors show a significant and positive relationship with purchase intention at p-value < 0.05. However, 2 other variables
show negative relationship with purchase intention at p-value > 0.05. The accepted variable includes perceived quality and brand loyalty, but the
rejected variable are brand awareness and brand association. The two accepted variable, perceived quality and brand loyalty shows the strongest
predicator for purchase intention with beta value of 0.001.
Table 6: Multiple Regression
a
Coefficients
Model Unstandardized Standardized t Sig.
Coefficients
Coefficients
B Std. Beta
Error
1 (Constant) .160 .229 .701 .484
BA_AVG .012 .110 .011 .112 .911
BAS_AVG .109 .098 .118 1.114 .267
PQ_AVG .402 .107 .331 3.763 .001
BL_AVG .451 .094 .479 4.790 .001
a. Dependent Variable: PI_AVG
4.6 SUMMARY OF HYPOTHESIS TESTING
Two of the hypotheses proposed in this study are supported, as shown in Table 7. This means that perceived
quality and brand loyalty are related to purchase intent in a positive way. Furthermore, brand awareness and brand
association have no effect on purchase intention.
Table 7: Hypothesis Testing
Hypothesis Testing
H1: Brand awareness has a significant effect on customer’ purchase intention Rejected
H2: Brand association has a significant effect on customer’ purchase intention Rejected
H3: Perceived quality has a significant effect on customer’ purchase intention Accepted
H4: Brand Loyalty has a significant effect impact on customer’ purchase Accepted
intention
4.7 SUMMARY
Finally, perceived quality and brand loyalty both have a positive and significant relationship with purchase intention. Most respondents were females
between the ages of 18 and 24, held a bachelor’s degree, and were from the Mentakab district. The following chapter discusses a summary of the
research objectives, as well as the implications, limitations, and recommendations for future research.
Table 8: Summary
RO Data Collected Analysis Rules of Thumbs Results
1 Respondents’s Demographic profile Frequency Percentage
741