
Page 829 - MARSIUM'21 COMP OF PAPER
P. 829
830 JieQi & Mazilah (2021)
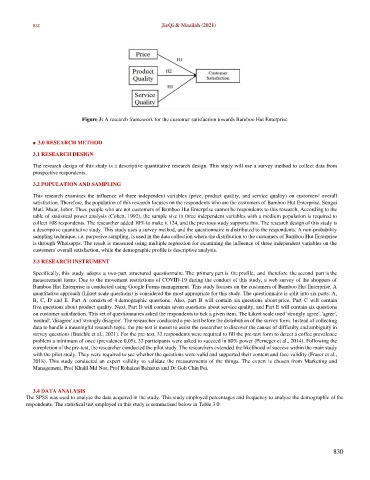
Figure 3: A research framework for the customer satisfaction towards Bamboo Hut Enterprise
■ 3.0 RESEARCH METHOD
3.1 RESEARCH DESIGN
The research design of this study is a descriptive quantitative research design. This study will use a survey method to collect data from
prospective respondents.
3.2 POPULATION AND SAMPLING
This research examines the influence of three independent variables (price, product quality, and service quality) on customers' overall
satisfaction. Therefore, the population of this research focuses on the respondents who are the customers of Bamboo Hut Enterprise, Sungai
Mati, Muar, Johor. Thus, people who are not customers of Bamboo Hut Enterprise cannot be respondents to this research. According to the
table of statistical power analysis (Cohen, 1992), the sample size in three independent variables with a medium population is required to
collect 108 respondents. The researcher added 10% to make it 124, and the previous study supports this. The research design of this study is
a descriptive quantitative study. This study uses a survey method, and the questionnaire is distributed to the respondents. A non-probability
sampling technique, i.e. purposive sampling, is used in the data collection where the distribution to the customers of Bamboo Hut Enterprise
is through Whatsapps. The result is measured using multiple regression for examining the influence of three independent variables on the
customers' overall satisfaction, while the demographic profile is descriptive analysis.
3.3 RESEARCH INSTRUMENT
Specifically, this study adopts a two-part structured questionnaire. The primary part is the profile, and therefore the second part is the
measurement items. Due to the movement restrictions of COVID-19 during the conduct of this study, a web survey of the shoppers of
Bamboo Hut Enterprise is conducted using Google Forms management. This study focuses on the customers of Bamboo Hut Enterprise. A
quantitative approach (Likert scale questions) is considered the most appropriate for this study. The questionnaire is split into six parts: A,
B, C, D and E. Part A consists of 4 demographic questions. Also, part B will contain six questions about price. Part C will contain
five questions about product quality. Next, Part D will contain seven questions about service quality, and Part E will contain six questions
on customer satisfaction. This set of questionnaires asked the respondents to tick a given item. The Likert scale used 'strongly agree', 'agree',
'neutral', 'disagree' and 'strongly disagree'. The researcher conducted a pre-test before the distribution of the survey form. Instead of collecting
data to handle a meaningful research topic, the pre-test is meant to assist the researcher to discover the causes of difficulty and ambiguity in
survey questions (Buschle et al., 2021). For the pre-test, 32 respondents were required to fill the pre-test form to detect a coffee prevalence
problem a minimum of once (prevalence 0.05), 32 participants were asked to succeed in 80% power (Perneger et al., 2014). Following the
completion of the pre-test, the researcher conducted the pilot study. The researchers extended the likelihood of success within the main study
with the pilot study. They were required to see whether the questions were valid and supported their content and face validity (Fraser et al.,
2018). This study conducted an expert validity to validate the measurements of the things. The expert is chosen from Marketing and
Management, Prof Khalil Md Nor, Prof Rohaizat Baharun and Dr Goh Chin Fei.
3.4 DATA ANALYSIS
The SPSS was used to analyse the data acquired in the study. This study employed percentages and frequency to analyse the demographic of the
respondents. The statistical test employed in this study is summarised below in Table 3.0:
830