
Page 830 - MARSIUM'21 COMP OF PAPER
P. 830
831 JieQi & Mazilah (2021)
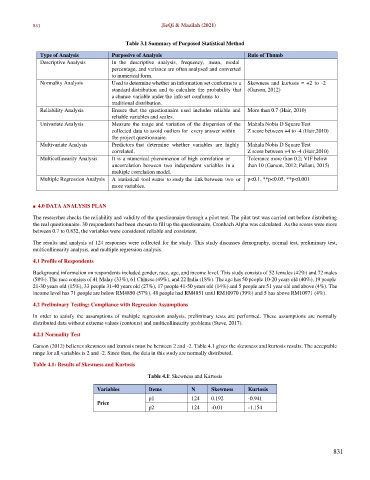
Table 3.1 Summary of Purposed Statistical Method
Type of Analysis Purposive of Analysis Rule of Thumb
Descriptive Analysis In the descriptive analysis, frequency, mean, modal
percentage, and variance are often analysed and converted
to numerical form.
Normality Analysis Used to determine whether an information set conforms to a Skewness and kurtosis = +2 to -2
standard distribution and to calculate the probability that (Garson, 2012)
a chance variable under the info set conforms to
traditional distribution.
Reliability Analysis Ensure that the questionnaire used includes reliable and More than 0.7 (Hair, 2010)
reliable variables and scales.
Univariate Analysis Measure the range and variation of the dispersion of the Mahala Nobis D Square Test
collected data to avoid outliers for every answer within Z score between +4 to -4 (Hair,2010)
the project questionnaire.
Multivariate Analysis Predictors that determine whether variables are highly Mahala Nobis D Square Test
correlated. Z score between +4 to -4 (Hair,2010)
Multicollinearity Analysis It is a numerical phenomenon of high correlation or Tolerance more than 0.2; VIF below
uncorrelation between two independent variables in a than 10 (Garson, 2012; Pallant, 2015)
multiple correlation model.
Multiple Regression Analysis A statistical tool wants to study the link between two or p<0.1, **p<0.05, **p<0.001
more variables.
■ 4.0 DATA ANALYSIS PLAN
The researcher checks the reliability and validity of the questionnaire through a pilot test. The pilot test was carried out before distributing
the real questionnaire. 30 respondents had been chosen to fill up the questionnaire. Cronbach Alpha was calculated. As the scores were more
between 0.7 to 0.832, the variables were considered reliable and consistent.
The results and analysis of 124 responses were collected for the study. This study discusses demography, normal test, preliminary test,
multicollinearity analysis, and multiple regression analysis.
4.1 Profile of Respondents
Background information on respondents included gender, race, age, and income level. This study consists of 52 females (42%) and 72 males
(58%). The race consists of 41 Malay (33%), 61 Chinese (49%), and 22 India (18%). The age has 50 people 10-20 years old (40%), 19 people
21-30 years old (15%), 33 people 31-40 years old (27%), 17 people 41-50 years old (14%) and 5 people are 51 year old and above (4%). The
income level has 71 people are below RM4850 (57%), 48 people had RM4851 until RM10970 (39%) and 5 has above RM10971 (4%).
4.2 Preliminary Testing: Compliance with Regression Assumptions
In order to satisfy the assumptions of multiple regression analysis, preliminary tests are performed. These assumptions are normally
distributed data without extreme values (contours) and multicollinearity problems (Steve, 2017).
4.2.1 Normality Test
Garson (2012) believes skewness and kurtosis must be between 2 and -2. Table 4.1 gives the skewness and kurtosis results. The acceptable
range for all variables is 2 and -2. Since then, the data in this study are normally distributed.
Table 4.1: Results of Skewness and Kurtosis
Table 4.1: Skewness and Kurtosis
Variables Items N Skewness Kurtosis
p1 124 0.192 -0.941
Price
p2 124 -0.01 -1.154
831