
Page 831 - MARSIUM'21 COMP OF PAPER
P. 831
832 JieQi & Mazilah (2021)
p3 124 -0.062 -1.333
p4 124 -0.373 -0.843
p5 124 0.266 -0.817
p6 124 0.038 -0.78
Pq1 124 0.404 -0.95
pq2 124 0.368 -1.134
Product Quality pq3 124 0.416 -0.641
pq4 124 -0.136 -0.942
pq5 124 0.101 -1.228
sq1 124 -0.028 -0.97
sq2 124 0.441 -0.48
sq3 124 0.99 0.632
Service Quality sq4 124 0.29 -1.039
sq5 124 0.209 -0.562
sq6 124 0.574 -0.705
sq7 124 -0.062 0.668
cs1 124 0.55 -0.179
cs2 124 -0.049 -1.157
Customer cs3 124 0.612 -0.847
Satisfaction cs4 124 0.237 -0.443
cs5 124 0.633 -0.498
cs6 124 -0.216 -1.017
4.2.2 Univariable and Multivariable Analysis
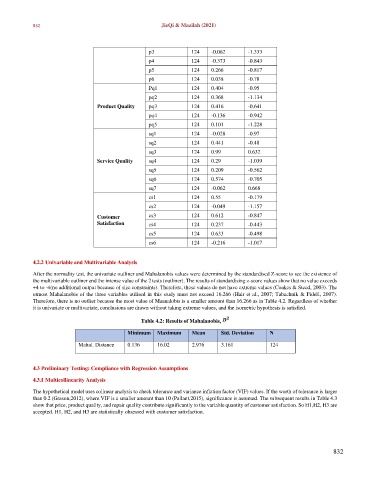
After the normality test, the univariate outliner and Mahalanobis values were determined by the standardised Z-score to see the existence of
the multivariable outliner and the intense value of the 2 tests (outliner). The results of standardising z-score values show that no value exceeds
+4 to -4(no additional output because of size constraints). Therefore, these values do not have extreme values (Coakes & Steed, 2003). The
utmost Mahalanobis of the three variables utilised in this study must not exceed 16.266 (Hair et al., 2007; Tabachnik & Fidell, 2007).
Therefore, there is no outlier because the most value of Maanalobis is a smaller amount than 16.266 as in Table 4.2. Regardless of whether
it is univariate or multivariate, conclusions are drawn without taking extreme values, and the isometric hypothesis is satisfied.
Table 4.2: Results of Mahalanobis,
Minimum Maximum Mean Std. Deviation N
Mahal. Distance 0.136 16.02 2.976 3.161 124
4.3 Preliminary Testing: Compliance with Regression Assumptions
4.3.1 Multicollinearity Analysis
The hypothetical model uses colinear analysis to check tolerance and variance inflation factor (VIF) values. If the worth of tolerance is larger
than 0.2 (Grason,2012), where VIF is a smaller amount than 10 (Pallant,2015), significance is assumed. The subsequent results in Table 4.3
show that price, product quality, and repair quality contribute significantly to the variable quantity of customer satisfaction. So H1, H2, H3 are
accepted. H1, H2, and H3 are statistically obsessed with customer satisfaction.
832