
Page 832 - MARSIUM'21 COMP OF PAPER
P. 832
833 JieQi & Mazilah (2021)
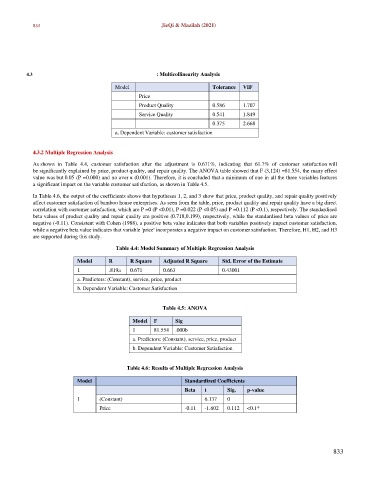
4.3 : Multicollinearity Analysis
Model Tolerance VIF
Price
Product Quality 0.586 1.707
Service Quality 0.541 1.849
0.375 2.668
a. Dependent Variable: customer satisfaction
4.3.2 Multiple Regression Analysis
As shown in Table 4.4, customer satisfaction after the adjustment is 0.671%, indicating that 61.7% of customer satisfaction will
be significantly explained by price, product quality, and repair quality. The ANOVA table showed that F (3,124) =81.554, the many effect
value was but 0.05 (P =0.000) and no over α (0.001). Therefore, it is concluded that a minimum of one in all the three variables features
a significant impact on the variable customer satisfaction, as shown in Table 4.5.
In Table 4.6, the output of the coefficients shows that hypotheses 1, 2, and 3 show that price, product quality, and repair quality positively
affect customer satisfaction of bamboo house enterprises. As seen from the table, price, product quality and repair quality have a big direct
correlation with customer satisfaction, which are P =0 (P <0.01), P =0.022 (P <0.05) and P =0.112 (P <0.1), respectively. The standardised
beta values of product quality and repair quality are positive (0.718,0.199), respectively, while the standardised beta values of price are
negative (-0.11). Consistent with Cohen (1988), a positive beta value indicates that both variables positively impact customer satisfaction,
while a negative beta value indicates that variable 'price' incorporates a negative impact on customer satisfaction. Therefore, H1, H2, and H3
are supported during this study.
Table 4.4: Model Summary of Multiple Regression Analysis
Model R R Square Adjusted R Square Std. Error of the Estimate
1 .819a 0.671 0.663 0.43001
a. Predictors: (Constant), service, price, product
b. Dependent Variable: Customer Satisfaction
Table 4.5: ANOVA
Model F Sig
1 81.554 .000b
a. Predictors: (Constant), service, price, product
b. Dependent Variable: Customer Satisfaction
Table 4.6: Results of Multiple Regression Analysis
Model Standardized Coefficients
Beta t Sig. p-value
1 (Constant) 6.137 0
Price -0.11 -1.602 0.112 <0.1*
833