
Page 23 - NCJA Journal_volume1_issue1-final
P. 23
Are the services delivered considered evidence-based? And how does the agency
evaluate program success?
Given the racial disproportionality that exists in juvenile justice, what efforts does
the agency take within the diversion services to reduce disparate outcomes for
children and families of color?
What steps does the agency take to improve individual decision-making (explicitly
or implicitly directed at preventing youth from re-offending)? And what steps does
the agency take to empower families?
The constant comparison method (Bulmer, 1979) was used to categorize and contextualize (Miles
& Huberman, 1984) the qualitative data. These data were also analyzed to evaluate the established
goals of the Youth Diversion Program.
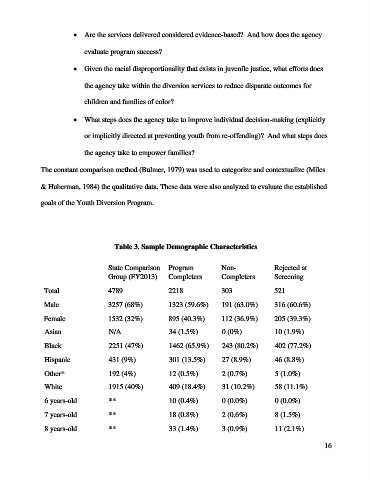
Table 3. Sample Demographic Characteristics
State Comparison Program Non- Rejected at
Group (FY2013) Completers Completers Screening
Total 4789 2218 303 521
Male 3257 (68%) 1323 (59.6%) 191 (63.0%) 316 (60.6%)
Female 1532 (32%) 895 (40.3%) 112 (36.9%) 205 (39.3%)
Asian N/A 34 (1.5%) 0 (0%) 10 (1.9%)
Black 2251 (47%) 1462 (65.9%) 243 (80.2%) 402 (77.2%)
Hispanic 431 (9%) 301 (13.5%) 27 (8.9%) 46 (8.8%)
Other* 192 (4%) 12 (0.5%) 2 (0.7%) 5 (1.0%)
White 1915 (40%) 409 (18.4%) 31 (10.2%) 58 (11.1%)
6 years-old ** 10 (0.4%) 0 (0.0%) 0 (0.0%)
7 years-old ** 18 (0.8%) 2 (0.6%) 8 (1.5%)
8 years-old ** 33 (1.4%) 3 (0.9%) 11 (2.1%)
16