
Page 25 - NCJA Journal_volume1_issue1-final
P. 25
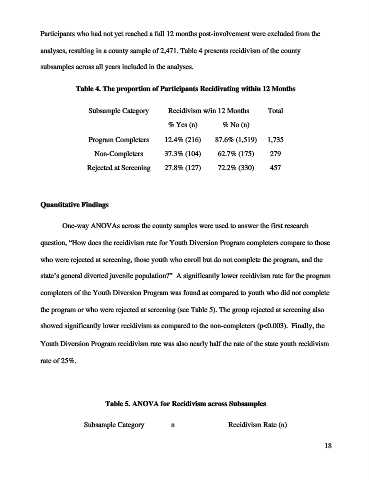
Participants who had not yet reached a full 12 months post-involvement were excluded from the


              analyses, resulting in a county sample of 2,471. Table 4 presents recidivism of the county

              subsamples across all years included in the analyses.


                          Table 4. The proportion of Participants Recidivating within 12 Months


                              Subsample Category         Recidivism w/in 12 Months       Total

                                                         % Yes (n)        % No (n)

                              Program Completers       12.4% (216)      87.6% (1,519)    1,735

                                Non-Completers         37.3% (104)       62.7% (175)      279

                              Rejected at Screening    27.8% (127)       72.2% (330)      457


              Quantitative Findings


                      One-way ANOVAs across the county samples were used to answer the first research

              question, “How does the recidivism rate for Youth Diversion Program completers compare to those


              who were rejected at screening, those youth who enroll but do not complete the program, and the

              state’s general diverted juvenile population?”  A significantly lower recidivism rate for the program


              completers of the Youth Diversion Program was found as compared to youth who did not complete

              the program or who were rejected at screening (see Table 5). The group rejected at screening also

              showed significantly lower recidivism as compared to the non-completers (p<0.003).  Finally, the


              Youth Diversion Program recidivism rate was also nearly half the rate of the state youth recidivism

              rate of 25%.


                                    Table 5. ANOVA for Recidivism across Subsamples


                             Subsample Category           n                 Recidivism Rate (n)


                                                                                                            18