
Page 26 - NCJA Journal_volume1_issue1-final
P. 26
A. Program Completers 1735 12.4% (216)*
B. Non-Completers 279 37.3% (104)
C. Rejected at Screening 457 27.8% (127)**
D. State 14,120 25% (3,530)
*Significant difference from B and C (p < 0.001)
**Significant difference from C (p < 0.05)
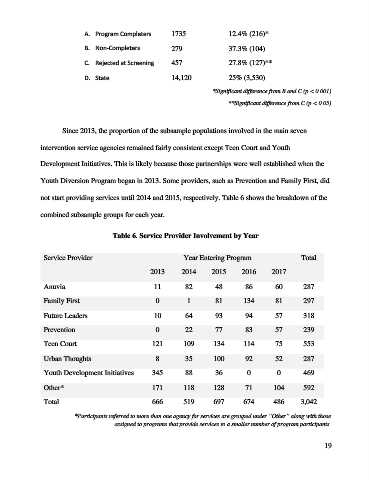
Since 2013, the proportion of the subsample populations involved in the main seven
intervention service agencies remained fairly consistent except Teen Court and Youth
Development Initiatives. This is likely because those partnerships were well established when the
Youth Diversion Program began in 2013. Some providers, such as Prevention and Family First, did
not start providing services until 2014 and 2015, respectively. Table 6 shows the breakdown of the
combined subsample groups for each year.
Table 6. Service Provider Involvement by Year
Service Provider Year Entering Program Total
2013 2014 2015 2016 2017
Anuvia 11 82 48 86 60 287
Family First 0 1 81 134 81 297
Future Leaders 10 64 93 94 57 318
Prevention 0 22 77 83 57 239
Teen Court 121 109 134 114 75 553
Urban Thoughts 8 35 100 92 52 287
Youth Development Initiatives 345 88 36 0 0 469
Other* 171 118 128 71 104 592
Total 666 519 697 674 486 3,042
*Participants referred to more than one agency for services are grouped under “Other” along with those
assigned to programs that provide services to a smaller number of program participants.
19