
Page 182 - Advanced Course
P. 182
KNX ADVANCED COURSE
the logarithmic impression of brightness by the human eye and is much better than a
linear output (equidistant values) of sensor 2. Still an option of limiting the amount of bus
telegrams per time unit should be available (not visible in this example here).
Regarding sensor 2 (Figure 18 lower image): If a measured value interval of 64 lux is still
nd
sufficient in the lower range (see 2 example above), then the factor should be 8 instead
of 4 as shown. During cyclical repetition of the measured value – if parameterised –values
like those shown above are completely unsuitable: assuming that 10 control curves are
implemented, up to 11 telegrams in total can occur every 650 msec. The bus load would
then already be over 30%. The aim should however be to remain below 2%. Assuming
that a maximum of 45 telegrams can be sent on the line on average, then 2% would
correspond to 0.9 telegrams / sec. In the case of the aforementioned 11 telegrams per
measured value, this means that a measured value may be sent approx. every 12
seconds. This timing resolution is probably quick enough, primarily, because the controller
calculates the new control values in proportion and does not always send constant
dimming steps as in integral-action closed-loop control. The correct parameter
combination for sending the cyclical measured values is then:
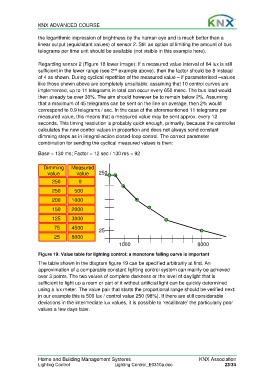
Base = 130 ms; Factor = 12 sec / 130 ms = 92
Dimming Measured
value value 250
250 0
250 500
200 1000
150 2000
125 3000
75 4500 25
25 8000
1000 8000
Figure 19: Value table for lighting control: a monotone falling curve is important
The table shown in the diagram figure 19 can be specified arbitrarily at first. An
approximation of a comparable constant lighting control system can mainly be achieved
over 3 points. The two values of complete darkness or the level of daylight that is
sufficient to light up a room or part of it without artificial light can be quickly determined
using a lux meter. The value pair that starts the proportional range should be verified next:
in our example this is 500 lux / control value 250 (98%). If there are still considerable
deviations in the intermediate lux values, it is possible to ‘recalibrate’ the particularly poor
values a few days later.
Home and Building Management Systems KNX Association
Lighting Control Lighting Control_E0310a.doc 23/34