
Page 8 - GeoPRISMS_Newsletter_Spring2018_Neat
P. 8
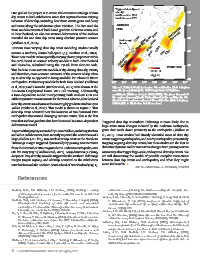
Triggered slow slip and
        One goal of the project is to create self-consistent catalogs of slow   afterslip:                         -38˚
                                                                       mid-November 2016
        slip events in both subduction zones that capture the time varying   to mid-January 2017
        behavior of slow slip, including how these events grow and decay
        and move along the subduction plate interface. The data used for   Australian                              -39˚
        these models consists of land-based geodetic GPS time series, and   Plate
        in New Zealand, we also use vertical deformation of the seafloor                       30 km    East Coast SSE
        recorded for one slow slip event using absolute pressure sensors           75 km   40 km         (2-3 weeks)   -40˚
        (Wallace et al., 2016).                                           Marlborough  50 km  25 km
                                                                          Sounds
        Previous time varying slow slip event modeling studies usually              Kapiti SSE  20 km  12 km
        assume a uniform, elastic half-space (e.g. Bartlow et al., 2014).                   15 km   9 km  6 km     -41˚
        These new models utilize spatially-varying elastic properties within
        the earth based on seismic velocity models in both New Zealand    Marlborough
        and Cascadia, calculated using the PyLith finite element code.     Afterslip                   Pacic Plate  -42˚
        This leads to more accurate models of slip during slow slip events,                 10 30 50
        and therefore, more accurate estimates of the amount of slip taken                  slip (cm)
        up in slow slip as opposed to being available for release in future                                        -43˚
        earthquakes. Preliminary models for both New Zealand (Williams   172˚  173˚  174˚  175˚  176˚  177˚  178˚  179˚
        et al., 2017) and Cascadia (Bartlow et al., 2017) were shown at the   Figure 2. Total slow slip (colors) on the subduction plate interface
        American Geophysical Union 2017 Fall meeting. Additionally,   over the year following the 2016 magnitude 7.8 Kaikōura
                                                                     earthquake (Wallace et al., in 2017, 2018). The green lines show
        a time-dependent model incorporating both onshore GPS and    the surface traces of faults that ruptured in the earthquake. The
        offshore pressure measurements for the 2014 Gisborne, New Zealand   black dashed contours represent the subduction plate interface,
        slow slip events was shown at the meeting by graduate student Ryan   with depths in kilometers below sea level.
        Yohler (Yohler et al., 2017). This model is shown in Figure 1. This
        slow slip event occurred near the locations of two historical 1947
        earthquakes that caused damaging tsunami waves. This is the first
        time that seafloor geodetic data have been used in a time-dependent   Triggered slow slip at southern Hikurangi is more likely due to
        deformation model.                                     large static stress changes induced by the Kaikōura earthquake,
        As part of this project, a team led by Laura Wallace, including Bartlow  given that area’s closer proximity to the earthquake (Wallace et
        and other collaborators, have recently reported the occurrence of a  al., 2018). Prior studies had already identified cases of slow slip
        large, shallow (<15 km), two-week slow slip event at the Northern  events triggering earthquakes, and nearby earthquakes prematurely
        Hikurangi margin triggered dynamically by passing seismic waves  stopping ongoing slow slip events, but these studies are the first to
        from the November 2016 magnitude 7.8 Kaikōura earthquake, over  show that dynamic and/or static stress changes from passing seismic
        600 km away (Fig. 2; Wallace et al., 2017). Long-duration (>1 year),  waves may also trigger large-scale, widespread slow slip events. We
        deep (>25 km) slow slip was also triggered at the southern Hikurangi  are still discovering the wealth of possible complex interactions
        margin (Kapiti region), and afterslip occurred on the subduction  between slow slip events and earthquakes, and what they might
        interface beneath the northern South Island of New Zealand (Fig. 1).  mean for hazards. ■
                                                                                    NSF GeoPRISMS Awards #1551876, 1551929


            References


        Bartlow,  N.M.,  C.A.  Williams,  L.M.  Wallace,  (2017),  Building  a  catalog   subduction  zone  following  the  Kaikōura  earthquake.  Geophys.  Res.
            of  time-dependent  inversions  for  Cascadia  ETS  events.  In  AGU  Fall   Lett., 45, doi.org/10.1002/2018GL077385
            Meeting Abstracts.                                 Wallace, L.M., Y. Kaneko, S. Hreinsdóttir, I. Hamling, Z. Peng, N.M. Bartlow,
        Bartlow, N.M., L.M. Wallace, R.J. Beavan, S. Bannister, P. Segall, (2014),   E.  D’Anastasio,  B.  Fry,  (2017),  Large-scale  dynamic  triggering  of
            Time‐dependent modeling of slow slip events and associated   shallow  slow  slip  enhanced  by  overlying  sedimentary  wedge.  Nat.
            seismicity and tremor at the Hikurangi subduction zone, New Zealand.   Geosci., 10(10), 765.
            J. Geophys. Res.: Solid Earth, 119(1), 734-753.    Wallace, L.M., S.C. Webb, Y. Ito, K. Mochizuki, R. Hino, S. Henrys, S. Schwartz,
        Ito, Y., R. Hino, M. Kido, H. Fujimoto, Y. Osada, D. Inazu, Y. Ohta, T. Linuma,   S., A.F. Sheehan, (2016), Slow slip near the trench at the Hikurangi
            M. Ohzono, S. Miura, M. Mishina, (2013), Episodic slow slip events in   subduction zone, New Zealand. Science, 352(6286), 701-704.
            the Japan subduction zone before the 2011 Tohoku-Oki earthquake.
            Tectonophysics, 600, 14-26.                        Williams,  C.A.,  L.M.  Wallace,  N.M.  Bartlow,  (2017),  Time-dependent
        Ruiz, S., M. Metois, A. Fuenzalida, J. Ruiz, F. Leyton, R. Grandin, C. Vigny,   inversions of slow slip at the Hikurangi subduction zone, New Zealand,
            R.  Madariaga,  J.  Campos,  (2014),  Intense  foreshocks  and  a  slow   using numerical Green’s functions. In AGU Fall Meeting Abstracts.
            slip event preceded the 2014 Iquique Mw 8.1 earthquake. Science,   Yohler,  R.M.,  N.M.  Bartlow,  L.M.  Wallace,  C.A.  Williams,  (2017),
            345(6201), 1165-1169.                                  Constraining slip distributions and onset of shallow slow slip in New
        Wallace, L.M., S. Hreinsdottir, S. Ellis, I. Hamling, E. D’Anastasio, P. Denys,   Zealand by joint inversions of onshore and offshore geodetic data. In
            (2018), Triggered slow slip and afterslip on the southern Hikurangi   AGU Fall Meeting Abstracts.

        8  •  GeoPRISMS Newsletter  Issue No. 40  Spring 2018