
Page 10 - GeoPRISMS_Newsletter_Spring2018_Neat
P. 10
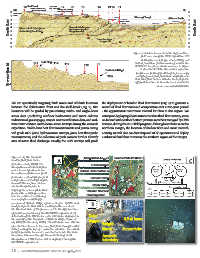
Miocene
               T8 Shelf break  (+/- Pliocene) T7  T6  T5    T4     T3 T2  T1
                    Pleistocene-recent
       0  NW     HSM-06A (lowstand wedge)  Stacked Late Quaternary                                              SE  0
                                    mass transport deposits
         Ariel Bank               HSM-01A&B
       1 Fault                                    HSM-07A             HSM-10A      Hikurangi Trough                 1
                                                     BSR
       2     10  ? 9  ?  ?        8  ?   BSR    6       5  4       HSM-04A Alternative to HSM-04A  HSM-05A  VB  Gisborne Knolls VB  2 3
                                                                          Deformation
      Depth (km)  4  Mesozoic & Paleogene  7  Mesozoic & Paleogene  3  2  VB  1  VB                                 4 5  Depth (km)
                                                                                                          HSM-08A
       3
                                                                           front
                                           backstop or accreted
       5
             deforming backstop
                                           Neogene rocks?
                                                    11
       6
       7                                              B?    Interplate thrust        HKB              B             6 7
       8                        B?                            in upper HKB  B                                       8
       9                                                                                                            9
       10  11
                                                                                  Figure 2. Seismic transects in the Top) northern
                                                                                       field area along the IODP Expedition 375
                                                                                       drilling transect (Saffer et al., 2017), and
                     T13  Uriti Ridge  T12  T11     T10     T9                     Bottom) southern field area along seismic line
      Two-way time (s)  2 4                                      Pukeroro Ridge    Note that flow meters will also be deployed in
                                                                                   PEG09-23. Locations shown as boxes in Figure
                                                                                      1. Arrows T1-T13 in the seismic reflection
                                                                                    profiles are primary fault targets for surveys,
                                                                                    sampling, and fluid flow meter deployments.
                                                                  2 km
                                                                                   off-fault locations to monitor local volumetric
                                                                                                strain associated with SSEs.
        We are specifically targeting fault zones and off-fault locations  the deployment of benthic fluid flow meters (Fig. 3) to generate a
        between the deformation front and the shelf-break (Fig. 2). Site  record of fluid flow rates and composition over a two-year period
        locations will be guided by pre-existing multi- and single-beam  - the approximate recurrence interval for SSEs in this region. We
        sonar data (including seafloor backscatter and water column  anticipate deploying about sixteen benthic fluid flow meters, some
        indicators of gas seepage), 2D/3D seismic reflection data, and real-  co-located with seafloor bottom pressure recorders managed by GNS
        time water column multi-beam sonar surveys during the research  Science, during the 2019 field program.Although our focus is on the
        expedition. Violin-bow heat flow measurements and piston coring  northern margin, the location of shallow SSEs and most research
        will guide ROV Jason hydroacoustic surveys, Jason heat flow probe  activity, we will also conduct ship and ROV operations and deploy
        measurements, and the collection of push cores to further identify  a subset of fluid flow meters in the southern region of the margin.
        sites of active fluid discharge. Finally, the ROV surveys will guide


        Figure 3. A) The Mosquito                   Temperature Logger  Release Plate Position B
        benthic fluid flow meter    A                                                                               C
        (Solomon et al., 2008). The                      OsmoSampler
        Mosquito uses OsmoSamplers
        and a tracer injection device             Release Plate Position A
        to continuously measure fluid
        flow rates and sample for fluid                 Osmotic Pump
        composition at multiple depths
        beneath the seafloor. Picture                    Teon Tubing
        shows Mosquito prior to
        tripping the release plate that               Titanium Needles/
        pushes the sampling needles                   Tracer Injection
        into the sediment and during
        recovery after sampling for
        one year at Hydrate Ridge, offshore Oregon. B) OSU violin
        heat flow probe that will be used to further constrain   B
        the thermal state of the forearc and to identify locations
        of fluid transport during the SAFFRONZ experiment. C)
        Schematic of the CAT meter and a CAT meter deployed in   Data
        the vicinity of the Mosquito at Hydrate Ridge (Tryon et   logger    3.5-m lance
        al., 2002; Brown et al., 2005). The CAT meter uses dilution   Weight
        of a chemical tracer to measure fluid flow through outlet
        tubing exiting the top of a collection chamber. An osmotic   Stand  Sensor tube
        pump injects the tracer at a constant rate into the water
        stream as it moves through the outlet tubing. Both     Acoustic
        Mosquitos and CAT meters will be deployed during the   telemetry
        SAFFRONZ experiment.

        10  •  GeoPRISMS Newsletter  Issue No. 40  Spring 2018