
Page 9 - GeoPRISMS_Newsletter_Spring2018_Neat
P. 9
Probing the nature of the Hikurangi margin
hydrogeologic system
Evan A. Solomon (University of Washington), Marta Torres (Oregon State University),
and Robert Harris (Oregon State University)
luid generation, migration, and pore fluid pressure at SAFFRONZ will complement and extend these efforts by providing:
subduction zones are hypothesized to exert a primary control 1. A continuous two-year record of fluid flow rates and
Fon the generation of seismicity, low-frequency earthquakes, composition over the timeframe of the next expected SSE,
and slow slip events (SSEs) (e.g. Ranero et al., 2008; Obana and
Kodaira, 2009; Saffer and Tobin, 2011; Saffer and Wallace, 2015). 2. Information on the present background state and past
The SAFFRONZ (Slow-slip and fluid flow response offshore New locations of fluid flow and how they relate to inferred pore fluid
Zealand) project addresses the GeoPRISMS Subduction Cycles and overpressure along the plate boundary, and
Deformation Initiative Science Plan by testing interrelationships 3. Comparative geochemical and hydrologic data between the
among fluid production, fluid flow, and slow slip at the Hikurangi northern and southern sections of the margin.
Margin. The recognition of dramatic changes in the along-strike The SAFFRONZ field program is scheduled for January 10 to
distributions of SSEs and their recurrence intervals, interseismic February 14, 2019 on the R/V Revelle. Our field strategy employs a
coupling, inferred pore pressure, and other subduction-related nested approach to constrain the margin-wide fluid flow distribution
parameters (Fig. 1) have resulted in a concerted international tied to estimated pore pressure evolution along the plate boundary
effort to acquire seismological, geodetic, from modeling studies and seismic attributes.
other geophysical, and geomechanical
data both onshore and offshore the Australian
South Plate North Island B .
Hikurangi margin. This effort includes Island 35 km C 180E
recent scientific ocean drilling, logging, 12 km 50 60 Australian Plate 35S
Australia Kermadec Tr. Tonga Tr.
6 km
and the deployment of two subseafloor 22
Pacic PAC/AUS coupling
observatories during IODP Expeditions Plate Hikurangi Trench 35 47 ~43 mm/yr 0 coecient 1 HT
372 and 375 (see page 16 of this issue), as Southern segment Central segment Northern segment A NZ
Pacic Plate
decreasing convergence rate at trench
well as a 3-D seismic reflection survey on few seamounts numerous seamounts
Sediment
the northern margin. (p. 14). increasing thickness of sediment on the incoming plate Kermadec Trench 37S
frontal accretion tectonic erosion/ tectonic erosion/ starved
dominant low accretion negligible accretion
wedge taper angle accretionary wedge taper
4-6 degrees angle 6-10 degrees
tectonic contraction back-arc extension and Ruatoria
PENINSULA
B
& strike-slip in upper plate strike-slip in upper plate avalanche
emerging uids have Seeps/springs in forearc RAUKUMARA Gisborne
no mantle component have strong mantle signature
& tectonic erosion
deep slow slip events & shallow SSEs & weak TVZ 39S
strong interseismic coupling interseismic coupling Hawke
Mt Ruapehu Bay
Mt Taranaki LR Hikurangi Subducted seamounts
Napier KR Channel
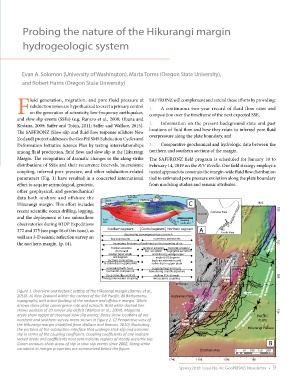
Figure 1. Overview and tectonic setting of the Hikurangi margin (Barnes et al., NIDFB
2010). A) New Zealand within the context of the SW Pacific. B) Bathymetry, Australian Plate 43 km/my
topography, and active faulting of the onshore and offshore margin. White
arrows show plate convergence rate and azimuth. Bold white dashed line
shows position of 20 mm/yr slip deficit (Wallace et al., 2004). Magenta WAIRARAPA 41S
areas show region of observed slow slip events. Boxes show locations of our Trough PACIFIC
dominant
northern and southern survey areas shown in Figure 2. C) Perspective view of Cook Frontal accretion PLATE
Wellington
the Hikurangi margin (modified from Wallace and Beavan, 2010) illustrating Strait Hikurangi
the portions of the subduction interface that undergo stick-slip and aseismic Hikurangi Plateau
Hikurangi
slip in terms of the coupling coefficient. Coupling coefficients of one indicate Channel
locked areas and coefficients near zero indicate regions of steady aseismic slip.
Green contours show areas of slip in slow slip events since 2002. Along strike B
variations in margin properties are summarized below the figure. Chatham Rise 0 50 100 150 200
km
174E 176E 178E 180
Spring 2018 Issue No. 40 GeoPRISMS Newsletter • 9