
Page 7 - MODULE QUALITY TOOLS DMQ 30262
P. 7
DMQ 30262
1.4 TOOLS FOR IMPROVING QUALITY PERFORMANCE
In this section we introduce the basic seven (B7) tools of quality. The seven basic
tools are simple to use in continuous improvement efforts. The tools often are used
by individuals and in teams. They are useful at all levels of the organization, and can
be applied by people of different educational levels. As you learn and apply the tools
of quality, you too will appreciate their wide application and usefulness.
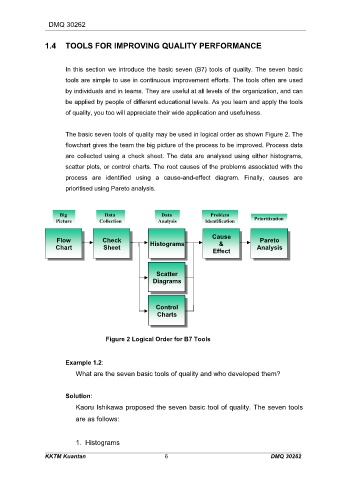
The basic seven tools of quality may be used in logical order as shown Figure 2. The
flowchart gives the team the big picture of the process to be improved. Process data
are collected using a check sheet. The data are analysed using either histograms,
scatter plots, or control charts. The root causes of the problems associated with the
process are identified using a cause-and-effect diagram. Finally, causes are
prioritised using Pareto analysis.
t
o
m
r
r
g
r
m
o
o
t
l
l
e
l
D D D
e
e
a
b
b
t
b
Data
a
a
g
Big
m
a
B B B i i i g Data D D D a t t t a a a Problem
a
a
a
P P P
a
t
z
i
a
t
t
r
r
i
z
a
t
a
i
i
t
z
r
r
i
i
n
i
i
i
i
i
i
o
r
o
o
o
P P P
r
t
n
n
o
o
i
i
n
o
o
o
n
n
n
o
o
i
n
n
o
e
e
e
d
d
d
n
n
n
a
a
a
l
l
y
y
y
l
i
i
i
s
s
s
t
c
c
a
i
i
c
t
t
t
a
a
A A A
i
i
f
t
t
i
n
n
i
f
f
n
r
c
c
e
r
r
u
u
t
c
t
t
C C C
l
l
o
o
o
l
e
e
l
l
l
i
i
c
c
c
i
P P P
Picture e e e Collection Analysis s s s I I I Identification Prioritization
i
i
i
t
t
t
u
s
a
e
u
s
e
u
a
Cause
s
Cause
a
a
u
u
e
s
e
F F F
Flow w Check k C C C C C C a a u u s s e e Pareto o
o
l
l
w
o
o
o
l
t
o
o
t
w
w
t
C C C
e
e
r
e
e
k
e
e
c
a
r
r
k
P P P
a
a
h
h
c
c
k
h
e
a
a
e
l
l
k
a
c
Flow
F F F
c
c
o
o
r
e
e
h
h
Check
w
r
r
e
h
w
Pareto
P P P
t
l
k
e
o
C C C
o
t
t
o
r
r
r
& & & &
s
m
s
s
m
a
a
m
a
t
o
t
t
o
g
g
o
g
s
s
s
i
i
i
H H H
m
Histograms
H H H
m
m
s
a
a
a
r
r
r
s
s
s
s
i
i
i
& & & &
o
o
o
t
t
t
g
g
g
s
s
h
i
s
s
e
s
e
s
e
a
r
Analysis
t
t
t
i
h
a
i
a
Sheet
h
C C C
h
e
e
a
y
a
y
h
h
y
e
a
Chart t t t r t t t S S S Sheet t t t Histograms s E E E Effect t t t A A A Analysis
n
n
n
l
l
l
r
r
A A A
s
s
a
a
s
a
h
h
h
s
s
s
a
a
a
l
e
e
e
h
h
l
h
S S S
i
i
i
r
y
y
Chart
r
C C C
y
e
e
l
e
n
n
n
f
e
e
f
f
f
f
f
e
c
c
c
Effect
t
t
t
f
c
f
f
c
f
e
e
f
c
e
f
E E E
t
t
e
t
t
a
S S S Scatter
a
Scatter
t
t
a
r
c
c
e
r
r
c
e
e
a
r
t
e
t
t
e
S S S
c
r
a
r
a
c
t
c
t
t
s
r
s
s
r
r
D D D Diagrams
Diagrams
g
a
i
a
a
a
a
m
a
i
g
g
m
i
m
r
g
r
s
s
r
a
a
a
i
i
i
s
m
m
a
a
D D D
g
a
m
g
o
o
o
t
n
r
n
Control l l l l l l
C C C
n
r
t
o
o
o
r
t
o
o
o
Control
n
n
C C C
n
o
t
t
t
r
o
o
r
r
h
h
h
C C C C C C h a a r r r t t t r s s
a
a
s
s
Charts
t
t
t
Charts
h
s
s
h
a
a
r
r
l
T
s
o
o
7
f
e
r
B
o
r
d
e
2
L
r
F
Figure 2 Logical Order for B7 Tools
i
u
g
O
l
r
a
g
o
c
i
Example 1.2:
What are the seven basic tools of quality and who developed them?
Solution:
Kaoru Ishikawa proposed the seven basic tool of quality. The seven tools
are as follows:
1. Histograms
KKTM Kuantan 6 DMQ 30262