
Page 23 - analysis-and-interpretation-of-astronomical-sp
P. 23
Analysis and Interpretation of Astronomical Spectra 23
corresponds to the theoretical maximum resolution [Å] of the
spectrograph, ie the smallest dimension of a line detail, which can be resolved.
The resolution is limited on one side by the optical design of the spectrograph (dispersion
of the grating, collimator optics, slit width, etc.). It can normally be found in the manual of
the spectrograph as so-called -Value which is valid for a defined wavelength
range ( = considered wavelength) [302].
This value is determined by measurements at thinnest possible spectral lines, eg
atmospheric H2O absorptions or somewhat less accurate, at emission lines of calibration
light sources [11], [123], [302]. In the laboratories for example emissionlines, generated by
microwave excited mercury lamps are used, in order to minimise temperature broadening.
Such profiles are called "instrumental profile" or "δ-function response" [11]. The resolution
may further be limited by the pixel grid of the connected camera [Å/pixel], if this value is
greater than of the spectrograph. For a wavelength-calibrated profile, this value is
shown in the head panel of the Vspec screen. Compared to monochrome-, with color CCD
cameras, a significant loss of resolution must be accepted.
7.5 , Equivalent Width
The EW-value or Equivalent Width is always based on the continuum level and is a
relative measure for the area of a spectral line.
Definition
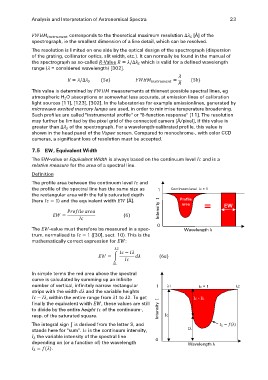
The profile area between the continuum level and
the profile of the spectral line has the same size as 1 Continuum level Ic = 1
the rectangular area with the fully saturated depth Profile
(here ) and the equivalent width [Å]. area
Intensity I = EW
The -value must therefore be measured in a spec- 0 Wavelength λ
trum, normalised to ([30], sect. 10). This is the
mathematically correct expression for :
In simple terms the red area above the spectral
curve is calculated by summing up an infinite
number of vertical, infinitely narrow rectangular
strips with the width and the variable heights 1 λ1 Ic = 1 λ2
, within the entire range from to . To get Intensity I Ic - Iλ
finally the equivalent width , these values are still
Iλ
to divide by the entire height of the continuum-, Wavelength λ
resp. of the saturated square. Ic
The integral sign ∫ is derived from the letter S, and 0
stands here for "sum". is the continuum intensity,
the variable intensity of the spectral line
depending on (or a function of) the wavelength
.