
Page 53 - analysis-and-interpretation-of-astronomical-sp
P. 53
Analysis and Interpretation of Astronomical Spectra 53
What is already clearly noticeable here?
– In the upper third of the table (B2-A5), the strong lines of the H-Balmer series, i.e. Hα,
Hβ, Hγ, etc. They appear most pronounced in the class A2 and are weakening from here
towards earlier and later spectral classes.
– In the lower quarter of the table (K5-M5) the eye-catching shaded bands of molecular
absorption spectra, mainly due to titanium oxide (TiO).
– Just underneath the half of the table some spectra (F5-K0), showing only few prominent
features, but charged with a large number of fine metal lines. Striking features here are
only the Na I double line (Fraunhofer D1, 2) and in the “blue” part the impressive Fraun-
hofer lines of Ca II (K + H), gaining strength towards later spectral classes. Fraunhofer H
at λ 3968 starts around the early F-class to overprint the weakening Hε hydrogen line at
λ 3970. In addition, the H-Balmer series is further weakening towards later classes.
– Finally on the top of the table the extremely hot O-class with very few fine lines, mostly
ionised helium (He II) and multiply ionised metals. The H-Balmer series appears here
quite weak, as a result of the extremely high temperatures. The telluric H2O and O2 ab-
sorption bands are reaching high intensities here, because the strongest radiation of the
star takes place in the ultraviolet whereas the telluric absorption bands are located in
the undisturbed domain near the infrared part of the spectrum. By contrast the maximum
radiation of the late spectral classes takes place in the infrared part, enabling the stellar
TiO absorption bands to overprint here the telluric lines.
– In the spectra of hot stars (~ classes from early A – O) the double line of neutral sodium
Na I (Fraunhofer D1,2) must imperatively be of interstellar origin. Neutral sodium Na I has
a very low ionisation energy of just 5.1 eV and can therefore exist only in the atmos-
pheres of relatively cool stars. The wavelengths of the ionised Na II lie already in the ul-
traviolet range and are therefore not detectable by amateur equipment.
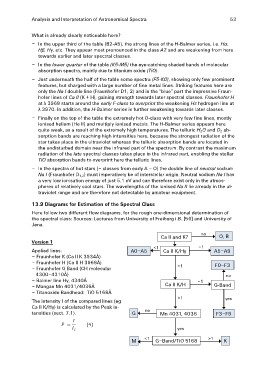
13.9 Diagrams for Estimation of the Spectral Class
Here follow two different flow diagrams, for the rough one-dimensional determination of
the spectral class: Sources: Lectures from University of Freiburg i.B. [56] and University of
Jena.
Version 1 Ca II and K? no O, B
A0–A5 <1 Ca II K/Hγ ~1 A5–A9
Applied lines:
– Fraunhofer K (Ca II K 3934Å) >1 F0–F3
– Fraunhofer H (Ca II H 3968Å)
– Fraunhofer G Band (CH molecular Ca II K/H no
4300–4310Å) ~1 G-Band
– Balmer line Hγ, 4340Å
– Mangan Mn 4031/4036Å >1 yes
– Titanoxide Bandhead: TiO 5168Å
G no Mn 4031, 4036 F3–F9
The intensity I of the compared lines (eg
Ca II K/Hγ) is calculated by the Peak in-
tensities (sect. 7.1).
yes
M <1 G–Band/TiO 5168 >1 K