
Page 116 - spectroscopic-atlas-5_0-english_Neat
P. 116
Spectroscopic Atlas for Amateur Astronomers 116
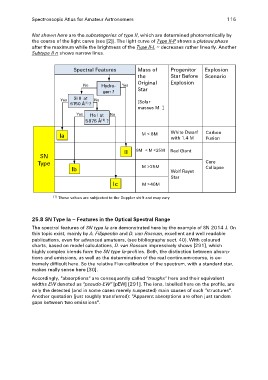
Not shown here are the subcategories of type II, which are determined photometrically by
the course of the light curve (see [2]). The light curve of Type II-P shows a plateau phase
after the maximum while the brightness of the Type II-L ~ decreases rather linearly. Another
Subtype II n shows narrow lines.
Spectral Features Mass of Progenitor Explosion
the Star Before Scenario
No Hydro- Yes Original Explosion
gen ? Star
Yes Si II at No [Solar
6150 Å(1) ?
masses M☉]
Yes He I at No
5876 Å(1) ?
Ia M < 8M☉ White Dwarf Carbon
with 1.4 M☉ Fusion
SN II 8M☉< M <25M☉ Red Giant Core
Type Collapse
M >25M☉
Ib
Wolf Rayet
Star
Ic M >40M☉
(1) These values are subjected to the Doppler shift and may vary
25.8 SN Type Ia – Features in the Optical Spectral Range
The spectral features of SN type Ia are demonstrated here by the example of SN 2014 J. On
this topic exist, mainly by A. Filippenko and D. van Rossum, excellent and well readable
publications, even for advanced amateurs, (see bibliography sect. 40). With coloured
charts, based on model calculations, D. van Rossum impressively shows [291], which
highly complex blends form the SN type Ia-profiles. Both, the distinction between absorp-
tions and emissions, as well as the determination of the real continuum-course, is ex-
tremely difficult here. So the relative Flux-calibration of the spectrum, with a standard star,
makes really sense here [30].
Accordingly, "absorptions" are consequently called "troughs" here and their equivalent
widths EW denoted as "pseudo-EW" [pEW] [291]. The ions, labelled here on the profile, are
only the detected (and in some cases merely suspected) main causes of such "structures".
Another quotation (just roughly transferred): "Apparent absorptions are often just random
gaps between two emissions".