
Page 25 - spectroscopic-atlas-5_0-english_Neat
P. 25
Spectroscopic Atlas for Amateur Astronomers 25
7 Appearance of Elements and Molecules in the Spectra
The spectrum of a star is primarily determined by the temperature of the photosphere. This
temperature defines directly the spectral class in the HRD. From secondary importance is
the density of the stellar atmosphere, primarily depending on the luminosity class, and fur-
ther the specific abundance of certain metals. Another influential parameter is the rotation
speed of the star, which, as a result of the Doppler Effect, broadens the spectral lines and
reduces their intensity.
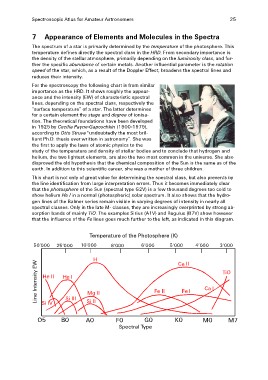
For the spectroscopy the following chart is from similar
importance as the HRD. It shows roughly the appear-
ance and the intensity (EW) of characteristic spectral
lines, depending on the spectral class, respectively the
“surface temperature” of a star. The latter determines
for a certain element the stage and degree of ionisa-
tion. The theoretical foundations have been developed
in 1925 by Cecilia Payne-Gaposchkin (1900-1979),
according to Otto Struve "undoubtedly the most bril-
liant Ph.D. thesis ever written in astronomy”. She was
the first to apply the laws of atomic physics to the
study of the temperature and density of stellar bodies and to conclude that hydrogen and
helium, the two lightest elements, are also the two most common in the universe. She also
disproved the old hypothesis that the chemical composition of the Sun is the same as of the
earth. In addition to this scientific career, she was a mother of three children.
This chart is not only of great value for determining the spectral class, but also prevents by
the line identification from large interpretation errors. Thus it becomes immediately clear
that the photosphere of the Sun (spectral type G2V) is a few thousand degrees too cold to
show helium He l in a normal (photospheric) solar spectrum. It also shows that the hydro-
gen lines of the Balmer series remain visible in varying degrees of intensity in nearly all
spectral classes. Only in the late M- classes, they are increasingly overprinted by strong ab-
sorption bands of mainly TiO. The examples Sirius (A1V) and Regulus (B7V) show however
that the influence of the Fe lines goes much further to the left, as indicated in this diagram.
Temperature of the Photosphere (K)
50‘000 25‘000 10‘000 8‘000 6‘000 5‘000 4‘000 3‘000
Line Intensity EW H Ca II
He II He I TiO
Mg II Fe II Fe I Ca I
Si III Si II
Si IV
O5 B0 A0 F0 G0 K0 M0 M7
Spectral Type