
Page 118 - Approved Annual Budget FY 2019-2020_Flat
P. 118
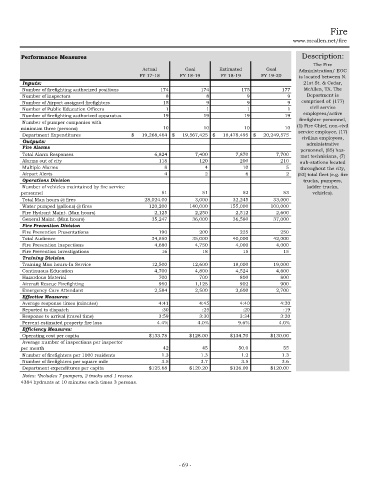
Fire
                                                                                                www.mcallen.net/fire

      Performance Measures                                                                         Description:
                                                                                                      The Fire
                                              Actual        Goal       Estimated       Goal      Administration/ EOC
                                             FY 17-18     FY 18-19      FY 18-19     FY 19-20     is located between N.
      Inputs:                                                                                      21st St. & Cedar,
      Number of firefighting authorized positions   174          174          175           177    McAllen, TX. The
      Number of inspectors                           8             8            9             9     Department is
      Number of Airport assigned firefighters        15            9            9             9   comprised of: (177)
      Number of Public Education Officers            1             1            1             1      civil service
      Number of firefighting authorized apparatus    19           19           19            19    employees/active
                                                                                                  firefighter personnel,
       Number of pumper companies with                                                           (1) Fire Chief, non-civil
      minimum three (persons)                        10           10           10            10  service employee, (17)
      Department Expenditures             $       19,268,464  $     19,567,425  $     18,478,495  $     20,249,575
      Outputs:                                                                                    civilian employees,
                                                                                                    administrative
      Fire Alarms                                                                                 personnel, (85) haz-
      Total Alarm Responses                        6,824         7,400        7,870         7,700  mat technicians, (7)
      Alarms out of city                             118           120          200           210  sub-stations located
      Multiple Alarms                                  8             4           10            5  throughout the city,
      Airport Alerts                                   4             2            6            2  (52) total fleet (e.g. fire
      Operations Division                                                                          trucks, pumpers,
       Number of vehicles maintained by fire service                                                ladder trucks,
      personnel                                       51            51           52            53     vehicles).
      Total Man hours @ fires                    28,024.00       3,000       32,245        33,000
      Water pumped (gallons) @ fires             120,200       140,000      155,000       100,000
      Fire Hydrant Maint. (Man hours)              2,125         2,250        2,512         2,600
      General Maint. (Man hours)                  35,247        36,000       36,580        37,000
      Fire Prevention Division
      Fire Prevention Presentations                  190           200          225           250
      Total Audience                              34,850        35,000       40,000        42,000
      Fire Prevention Inspections                  4,680         4,750        4,000         4,000
      Fire Prevention Investigations                  16            18           15            15
      Training Division
      Training Man hours-In Service               12,500        12,600       18,000        19,000
      Continuous Education                         4,700         4,800        4,524         4,600
      Hazardous Material                              700          700           800          800
      Aircraft Rescue Firefighting                    950         1,125          902          900
      Emergency Care Attendant                      2,584         2,500        2,600         2,700
      Effective Measures:
      Average response times (minutes)             4:41          4:45         4:40         4:30
      Reported to dispatch                          :30          :25           :20          :19
      Response to arrival (travel time)            3:59          3:30         3:34         3:20
      Percent estimated property fire loss         4.4%         4.0%         9.6%          4.0%
      Efficiency Measures:
      Operating cost per capita                 $133.78      $128.00       $134.70      $130.00
       Average number of inspections per inspector
      per month                                      42             45          50.0           55
       Number of firefighters per 1000 residents    1.3            1.3           1.2          1.3
      Number of firefighters per square mile        3.5             3.7          3.5          3.6
      Department expenditures per capita        $125.68      $120.20       $126.00      $120.00
      Notes: *Includes 7 pumpers, 2 trucks and 1 rescue.
      4384 hydrants at 10 minutes each times 3 persons.


                                                          - 69 -