
Page 123 - Approved Annual Budget FY 2019-2020_Flat
P. 123
Engineering
www.mcallen.net/engineering
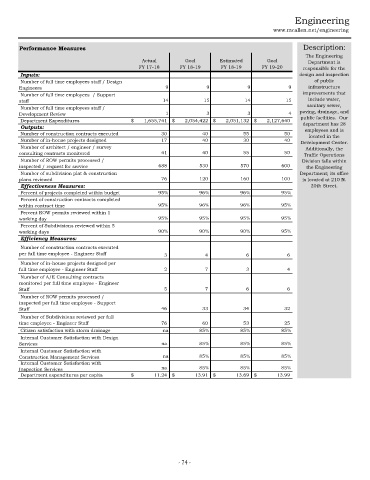
Performance Measures Description:
The Engineering
Actual Goal Estimated Goal Department is
FY 17-18 FY 18-19 FY 18-19 FY 19-20 responsible for the
Inputs: design and inspection
Number of full time employees staff / Design of public
Engineers 9 9 9 9 infrastructure
Number of full time employees / Support improvements that
staff 14 15 14 15 include water,
Number of full time employees staff / sanitary sewer,
Development Review 1 3 3 4 paving, drainage, and
Department Expenditures $ 1,655,741 $ 2,054,422 $ 2,051,132 $ 2,127,640 public facilities. Our
department has 28
Outputs: employees and is
Number of construction contracts executed 30 40 55 50 located in the
Number of in-house projects designed 17 40 30 40 Development Center.
Number of architect / engineer / survey Additionally, the
consulting contracts monitored 41 40 55 50 Traffic Operations
Number of ROW permits processed / Division falls within
inspected / request for service 688 530 570 600 the Engineering
Number of subdivision plat & construction Department; its office
plans reviewed 76 120 160 100 is located at 210 N.
Effectiveness Measures: 20th Street.
Percent of projects completed within budget 95% 96% 96% 95%
Percent of construction contracts completed
within contract time 95% 96% 96% 95%
Percent ROW permits reviewed within 1
working day 95% 95% 95% 95%
Percent of Subdivisions reviewed within 5
working days 90% 90% 90% 95%
Efficiency Measures:
Number of construction contracts executed
per full time employee - Engineer Staff 3 4 6 6
Number of in-house projects designed per
full time employee - Engineer Staff 2 7 3 4
Number of A/E Consulting contracts
monitored per full time employee - Engineer
Staff 5 7 6 6
Number of ROW permits processed /
inspected per full time employee - Support
Staff 46 33 34 32
Number of Subdivisions reviewed per full
time employee - Engineer Staff 76 60 53 25
Citizen satisfaction with storm drainage na 85% 85% 85%
Internal Customer Satisfaction with Design
Services na 85% 85% 85%
Internal Customer Satisfaction with
Construction Management Services na 85% 85% 85%
Internal Customer Satisfaction with
Inspection Services na 85% 85% 85%
Department expenditures per capita $ 11.24 $ 13.91 $ 13.69 $ 13.99
- 74 -