
Page 147 - Approved Annual Budget FY 2019-2020_Flat
P. 147
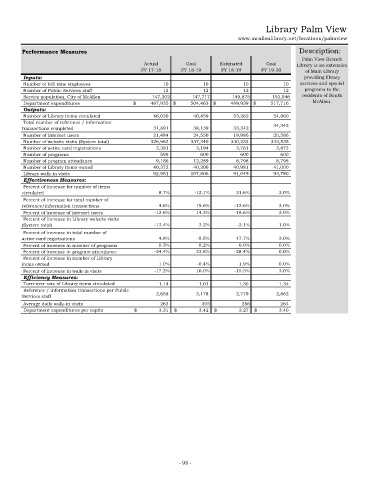
Library Palm View

                                                                             www.mcallenlibrary.net/locations/palmview
      Performance Measures                                                                        Description:
                                                                                                   Palm View Branch
                                              Actual        Goal       Estimated       Goal      Library is an extension
                                             FY 17-18      FY 18-19     FY 18-19     FY 19-20       of Main Library
      Inputs:                                                                                      providing library
      Number of full time employees                    10           10           10            10  services and special
       Number of Public Services staff                 12           12           12            12  programs to the
       Service population, City of McAllen       147,302      147,717      149,875       152,046   residents of South
       Department expenditures             $           487,935   $           504,463   $           489,939   $           517,716   McAllen.
      Outputs:
       Number of Library items circulated            46,030      40,459       53,262        54,860
       Total number of reference / information                                             34,342
      transactions completed                         31,891      38,139        33,342
       Number of internet users                      21,484      24,550       19,986        20,586
      Number of website visits (System total)     326,963      337,340      330,233       333,535
       Number of active card registrations            3,381         3,194        3,761        3,873
       Number of programs                              599          600          600           600
       Number of program attendance                   9,186      12,289         8,798         8,798
       Number of Library items owned                 40,372      40,200       40,981       41,000
       Library walk-in visits                        92,951    107,806        91,049       93,780
      Effectiveness Measures:
       Percent of increase for number of items
      circulated                                   8.7%        -12.1%        31.6%         3.0%
       Percent of increase for total number of
      reference/information transactions           4.6%        19.6%        -12.6%         3.0%
      Percent of increase of internet users       -12.6%       14.3%        -18.6%         3.0%
       Percent of increase in Library website visits
      (System total)                              -13.4%        3.2%         -2.1%         1.0%
       Percent of increase in total number of
      active card registrations                    4.8%         -5.5%        17.7%         3.0%
      Percent of increase in number of programs    0.3%         0.2%          0.0%         0.0%
      Percent of increase in program attendance   -24.4%       33.8%        -28.4%         0.0%
       Percent of increase in number of Library
      items owned                                  1.0%         -0.4%         1.9%         0.0%
       Percent of increase in walk-in visits      -17.2%       16.0%        -15.5%         3.0%
      Efficiency Measures:
      Turn-over rate of Library items circulated     1.14         1.01          1.30         1.34
       Reference / information transactions per Public
      Services staff                                  2,658         3,178        2,779        2,862
      Average daily walk-in visits                     263       305           256             264
       Department expenditures per capita   $                3.31   $                 3.42  $                 3.27  $                 3.40


                                                          - 98 -