
Page 143 - Approved Annual Budget FY 2019-2020_Flat
P. 143
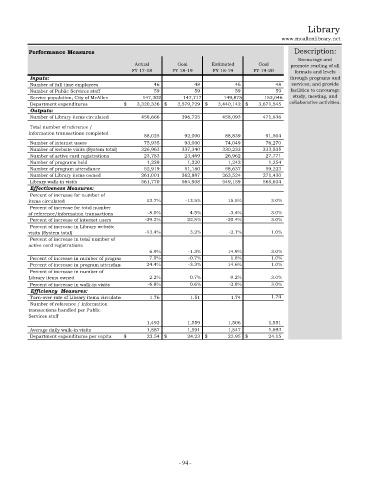
Library

                                                                                            www.mcallenlibrary.net
        Performance Measures                                                                    Description:
                                                                                                 Encourage and
                                           Actual        Goal        Estimated      Goal       promote reading of all
                                          FY 17-18      FY 18-19     FY 18-19     FY 19-20      formats and levels
         Inputs:                                                                              through programs and
         Number of full time employees              46           48            46           48  services; and provide
         Number of Public Services staff            59           59            59           59  facilities to encourage
         Service population, City of McAllen  147,302      147,717       149,875      152,046  study, meeting, and
         Department expenditures        $      3,320,336  $      3,579,729  $      3,440,142  $      3,671,545  collaborative activities.
         Outputs:
         Number of Library items circulated    458,666      396,725       458,093      471,836
         Total number of reference /
        information transactions completed
                                                88,025       92,000        88,839        91,504
         Number of internet users               75,935       93,000         74,049      76,270
         Number of website visits (System total)    326,963     337,340     330,233     333,535
         Number of active card registrations     23,783      23,469        26,962       27,771
         Number of programs held                 1,229        1,220         1,242        1,254
         Number of program attendance           52,919       51,180        58,637       59,223
         Number of Library items owned         261,001      262,887       263,524      271,430
         Library walk-in visits                561,770      564,908       549,159      565,634
         Effectiveness Measures:
         Percent of increase for number of
        items circulated                       13.7%        -13.5%        15.5%         3.0%
         Percent of increase for total number
        of reference/information transactions   -8.0%        4.5%         -3.4%         3.0%
         Percent of increase of internet users   -29.2%      22.5%       -20.4%         3.0%
         Percent of increase in Library website
        visits (System total)                  -13.4%        3.2%         -2.1%         1.0%
         Percent of increase in total number of
        active card registrations
                                                6.9%         -1.3%        14.9%         3.0%
         Percent of increase in number of program  7.9%      -0.7%         1.8%         1.0%
         Percent of increase in program attendanc  24.4%     -3.3%        14.6%         1.0%
         Percent of increase in number of
        Library items owned                     2.2%         0.7%          0.2%         3.0%
         Percent of increase in walk-in visits   -6.8%       0.6%         -2.8%         3.0%
         Efficiency  Measures:
         Turn-over rate of Library items circulated     1.76     1.51       1.74           1.74
         Number of reference / information
        transactions handled per Public
        Services staff
                                                  1,492        1,559         1,506        1,551
         Average daily walk-in visits            1,587        1,591         1,547         1,593
         Department expenditures per capita  $      22.54  $      24.23  $      22.95  $      24.15


                                                          - 94 -