
Page 156 - text book form physics kssm 2020
P. 156
2. Adjust the piston so that the volume of air in the syringe is 100 ml. Then, connect the
end of the syringe to a pressure gauge.
3. Take initial readings of the volume and pressure of the air in the syringe. Record the
readings in Table 4.10.
4. Push the piston slowly until the volume of air in the syringe becomes 90 ml. Take the
reading of the air pressure and record it in the table.
5. Repeat step 4 with volumes 80 ml, 70 ml and 60 ml.
6. Record all pressure, P in Table 4.10.
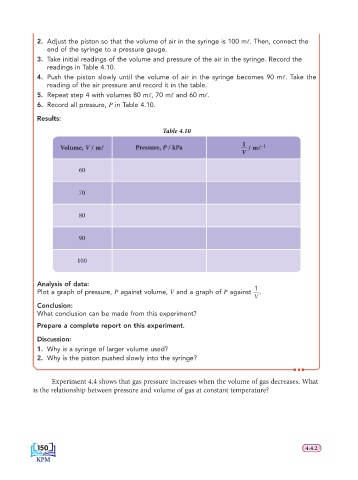
Results:
Table 4.10
1
Volume, V / ml Pressure, P / kPa / ml –1
V
60
70
80
90
100
Analysis of data:
1
Plot a graph of pressure, P against volume, V and a graph of P against .
V
Conclusion:
What conclusion can be made from this experiment?
Prepare a complete report on this experiment.
Discussion:
1. Why is a syringe of larger volume used?
2. Why is the piston pushed slowly into the syringe?
Experiment 4.4 shows that gas pressure increases when the volume of gas decreases. What
is the relationship between pressure and volume of gas at constant temperature?
150 4.4.2
150
150
4.4.2