Page 161 - text book form physics kssm 2020
P. 161

Chapter 4
                                                                                                     Heat
                                                                                       3
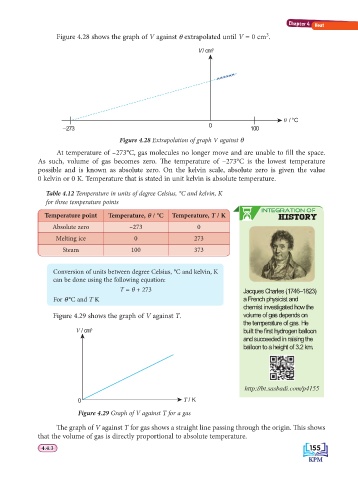
                        Figure 4.28 shows the graph of V against θ extrapolated until V = 0 cm .
                                                                  V / cm 3


                                                                                            e / °C
                                                                      0
                          –273                                                    100
                                           Figure 4.28 Extrapolation of graph V against θ

                        At temperature of –273°C, gas molecules no longer move and are unable to fi ll the space.
                  As such, volume of gas becomes zero. Th  e temperature of –273°C is the lowest temperature
                  possible and is known as absolute zero. On the kelvin scale, absolute zero is given the value
                  0 kelvin or 0 K. Temperature that is stated in unit kelvin is absolute temperature.

                     Table 4.12 Temperature in units of degree Celsius, °C and kelvin, K
                     for three temperature points
                                                                                     INTEGRATION OF
                    Temperature point  Temperature, θ / °C  Temperature, T / K             HISTORY

                       Absolute zero          –273                0
                        Melting ice            0                 273
                          Steam               100                373


                       Conversion of units between degree Celsius, °C and kelvin, K
                       can be done using the following equation:
                                           T = θ + 273                          Jacques Charles (1746–1823)
                       For θ °C and T K                                         a French physicist and
                                                                                chemist investigated how the
                       Figure 4.29 shows the graph of V against T.              volume of gas depends on
                                                                                the temperature of gas. He
                              V / cm 3                                          built the fi rst hydrogen balloon
                                                                                and succeeded in raising the
                                                                                balloon to a height of 3.2 km.


                                                                                http://bt.sasbadi.com/p4155
                              0                               T / K
                              Figure 4.29 Graph of V against T for a gas

                        Th  e graph of V against T for gas shows a straight line passing through the origin. Th is shows
                  that the volume of gas is directly proportional to absolute temperature.
                                                                                                    155
                   4.4.3                                                                            155
                   4.4.3
   156   157   158   159   160   161   162   163   164   165   166