
Page 160 - text book form physics kssm 2020
P. 160
2. Heat the water slowly and stir it continuously until the temperature of the water reaches
30°C.
3. Take the reading of the column of air, L in the capillary tube. Record the reading in
Table 4.11.
4. Repeat steps 2 and 3 for temperatures 40°C, 50°C, 60°C, 70°C and 80°C.
5. Record all lengths of column of air, L in Table 4.11.
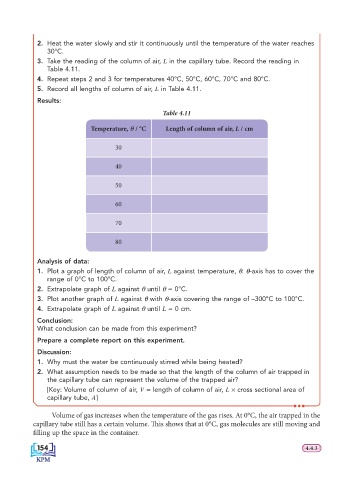
Results:
Table 4.11
Temperature, θ / °C Length of column of air, L / cm
30
40
50
60
70
80
Analysis of data:
1. Plot a graph of length of column of air, L against temperature, θ. θ-axis has to cover the
range of 0°C to 100°C.
2. Extrapolate graph of L against θ until θ = 0°C.
3. Plot another graph of L against θ with θ-axis covering the range of –300°C to 100°C.
4. Extrapolate graph of L against θ until L = 0 cm.
Conclusion:
What conclusion can be made from this experiment?
Prepare a complete report on this experiment.
Discussion:
1. Why must the water be continuously stirred while being heated?
2. What assumption needs to be made so that the length of the column of air trapped in
the capillary tube can represent the volume of the trapped air?
[Key: Volume of column of air, V = length of column of air, L × cross sectional area of
capillary tube, A]
Volume of gas increases when the temperature of the gas rises. At 0°C, the air trapped in the
capillary tube still has a certain volume. Th is shows that at 0°C, gas molecules are still moving and
fi lling up the space in the container.
154 4.4.3
154
4.4.3