
Page 157 - text book form physics kssm 2020
P. 157
Chapter 4
Heat
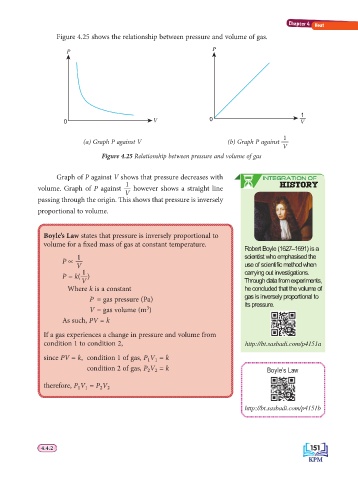
Figure 4.25 shows the relationship between pressure and volume of gas.
P P
1
0 V 0 —
V
1
(a) Graph P against V (b) Graph P against
V
Figure 4.25 Relationship between pressure and volume of gas
Graph of P against V shows that pressure decreases with INTEGRATION OF
1 HISTORY
volume. Graph of P against however shows a straight line
V
passing through the origin. Th is shows that pressure is inversely
proportional to volume.
Boyle’s Law states that pressure is inversely proportional to
volume for a fi xed mass of gas at constant temperature.
Robert Boyle (1627–1691) is a
1 scientist who emphasised the
P ∝
V use of scientifi c method when
1 carrying out investigations.
P = k( )
V Through data from experiments,
Where k is a constant he concluded that the volume of
gas is inversely proportional to
P = gas pressure (Pa)
its pressure.
3
V = gas volume (m )
As such, PV = k
If a gas experiences a change in pressure and volume from
condition 1 to condition 2, http://bt.sasbadi.com/p4151a
since PV = k, condition 1 of gas, P V = k
1 1
condition 2 of gas, P V = k Boyle’s Law
2 2
therefore, P V = P V
1 1
2 2
http://bt.sasbadi.com/p4151b
151
4.4.2 151
4.4.2