
Page 166 - text book form physics kssm 2020
P. 166
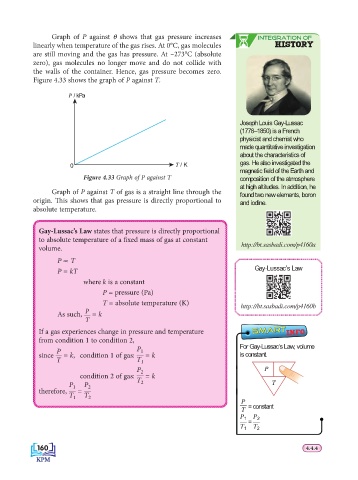
Graph of P against  θ shows that gas pressure increases       INTEGRATION OF
                 linearly when temperature of the gas rises. At 0°C, gas molecules        HISTORY
                 are still moving and the gas has pressure. At –273°C (absolute
                 zero), gas molecules no longer move and do not collide with
                 the walls of the container. Hence, gas pressure becomes zero.
                 Figure 4.33 shows the graph of P against T.

                           P / kPa


                                                                               Joseph Louis Gay-Lussac
                                                                               (1778–1850) is a French
                                                                               physicist and chemist who
                                                                               made quantitative investigation
                                                                               about the characteristics of
                            0                               T / K              gas. He also investigated the
                                                                               magnetic fi eld of the Earth and
                                Figure 4.33 Graph of P against T               composition of the atmosphere
                                                                               at high altitudes. In addition, he
                      Graph of P against T of gas is a straight line through the   found two new elements, boron
                 origin. Th  is shows that gas pressure is directly proportional to   and iodine.
                 absolute temperature.


                  Gay-Lussac’s Law states that pressure is directly proportional
                  to absolute temperature of a fi xed mass of gas at constant   http://bt.sasbadi.com/p4160a
                  volume.
                        P ∝ T
                        P = kT                                                     Gay-Lussac’s Law
                                where k is a constant
                                      P = pressure (Pa)
                                      T = absolute temperature (K)             http://bt.sasbadi.com/p4160b
                                P
                        As  such,   = k
                                T
                                                                                   SMART
                  If a gas experiences change in pressure and temperature             SMART  INFO
                  from condition 1 to condition 2,
                        P                       P 1                            For Gay-Lussac’s Law, volume
                  since   = k,  condition 1 of gas:   = k                      is constant.
                        T                       T 1
                                                P 2                                   P
                               condition 2 of gas:   = k
                                                T
                            P 1  P 2             2                                       T
                  therefore,   =
                           T 1  T 2
                                                                               P
                                                                               T   = constant
                                                                               P 1  P 2
                                                                               T 1  =  T 2


                  160
                  160                                                                              4.4.4
                                                                                                   4.4.4