
Page 165 - text book form physics kssm 2020
P. 165
Chapter 4
Heat
Results:
Table 4.13
Temperature, θ / °C Air pressure, P / kPa
30
40
50
60
70
80
Analysis of data:
1. Plot a graph of pressure, P against temperature, θ. θ-axis has to cover the range of
–300°C to 100°C.
2. Extrapolate the graph until P = 0 kPa. Determine the temperature when P = 0 kPa.
Conclusion:
What conclusion can be made from this experiment?
Prepare a complete report on this experiment.
Discussion:
1. What is the advantage of using a round-bottom fl ask to heat the air?
2. The thermometer is placed in the large beaker fi lled with water. What is the assumption
made so that the thermometer reading is the same as the temperature of the air in the
round-bottom fl ask?
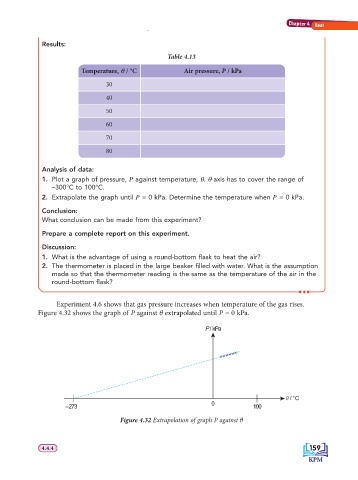
Experiment 4.6 shows that gas pressure increases when temperature of the gas rises.
Figure 4.32 shows the graph of P against θ extrapolated until P = 0 kPa.
P / kPa
ș / °C
–273 0 100
Figure 4.32 Extrapolation of graph P against θ
159
4.4.4
4.4.4 159