Page 45 - text book form physics kssm 2020
P. 45

Chapter 2  Force and Motion I

                  Analysis of Velocity-Time Graph to Determine Distance, Displacement, Velocity
                  and Acceleration
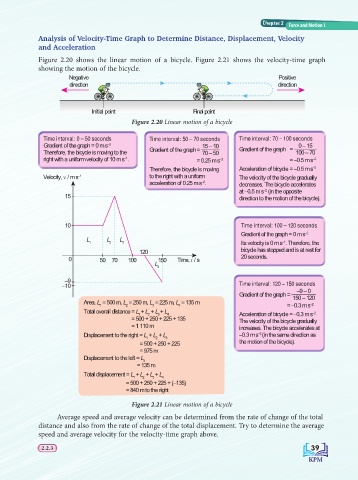
                  Figure 2.20 shows the linear motion of a bicycle. Figure 2.21 shows the velocity-time graph
                  showing the motion of the bicycle.
                            Negative                                                       Positive
                            direction                                                     direction


                                  Initial point                  Final point
                                              Figure 2.20 Linear motion of a bicycle

                    Time interval: 0 – 50 seconds   Time interval: 50 – 70 seconds  Time interval: 70 – 100 seconds
                    Gradient of the graph = 0 m s –2                15 – 10                      0 – 15
                    Therefore, the bicycle is moving to the   Gradient of the graph =   70 – 50  Gradient of the graph  =   100 – 70
                    right with a uniform velocity of 10 m s .     = 0.25 m s –2               = –0.5 m s
                                            –1
                                                                                                     –2
                                                    Therefore, the bicycle is moving   Acceleration of bicycle = –0.5 m s –2
                              –1
                    Velocity, v / m s               to the right with a uniform   The velocity of the bicycle gradually
                                                    acceleration of 0.25 m s .  decreases. The bicycle accelerates
                                                                   –2
                                                                               at –0.5 m s  (in the opposite
                                                                                      –2
                          15                                                   direction to the motion of the bicycle).
                          10                                                   Time interval: 100 – 120 seconds
                                                                               Gradient of the graph = 0 m s –2
                                 L     L   L
                                                                                            –1
                                  1     2   3                                  Its velocity is 0 m s . Therefore, the
                                                 120                           bicycle has stopped and is at rest for
                           0         50  70  100      150   Time, t / s        20 seconds.
                                                     L
                                                      4
                          –9
                         –10                                                   Time interval: 120 – 150 seconds
                                                                                                –9 – 0
                                                                               Gradient of the graph =   150 – 120
                                Area, L  = 500 m, L  = 250 m, L  = 225 m, L  = 135 m
                                                                                                    –2
                                     1       2       3      4                                = –0.3 m s
                                Total overall distance = L + L  + L + L   4    Acceleration of bicycle = –0.3 m s –2
                                                      3
                                                   2
                                                1
                                                                   = 500 + 250 + 225 + 135  The velocity of the bicycle gradually
                                                                   = 1 110 m   increases. The bicycle accelerates at
                                                                                    –2
                                Displacement to the right = L + L  + L         –0.3 m s (in the same direction as
                                                   1   2  3
                                                                         = 500 + 250 + 225  the motion of the bicycle).
                                                                         = 975 m
                                Displacement to the left = L
                                                  4
                                                                       = 135 m
                                Total displacement = L + L  + L + L
                                               1   2  3   4
                                                               = 500 + 250 + 225 + (–135)
                                                               = 840 m to the right
                                              Figure 2.21 Linear motion of a bicycle
                        Average speed and average velocity can be determined from the rate of change of the total
                  distance and also from the rate of change of the total displacement. Try to determine the average
                  speed and average velocity for the velocity-time graph above.

                                                                                                    39
                   2.2.3
                   2.2.3                                                                            39
   40   41   42   43   44   45   46   47   48   49   50