
Page 49 - text book form physics kssm 2020
P. 49
Chapter 2 Force and Motion I
Solving Problems Involving Linear Motion Graphs
Example 1
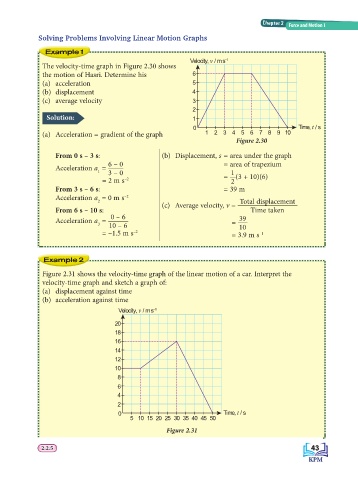
Velocity, v / m s –1
The velocity-time graph in Figure 2.30 shows
the motion of Hasri. Determine his 6
(a) acceleration 5
(b) displacement 4
(c) average velocity 3
2
Solution: 1
0 Time, t / s
(a) Acceleration = gradient of the graph 1 2 3 4 5 6 7 8 9 10
Figure 2.30
From 0 s – 3 s: (b) Displacement, s = area under the graph
6 – 0 = area of trapezium
Acceleration a =
1 3 – 0 1
–2
= 2 m s = 2 (3 + 10)(6)
From 3 s – 6 s: = 39 m
Acceleration a = 0 m s –2
2 Total displacement
(c) Average velocity, v =
From 6 s – 10 s: Time taken
0 – 6
Acceleration a = 39
3 10 – 6 = 10
= –1.5 m s –2 = 3.9 m s –1
Example 2
Figure 2.31 shows the velocity-time graph of the linear motion of a car. Interpret the
velocity-time graph and sketch a graph of:
(a) displacement against time
(b) acceleration against time
Velocity, v / m s –1
20
18
16
14
12
10
8
6
4
2
0 Time, t / s
5 10152025 3035 40 45 50
Figure 2.31
43
2.2.5 43
2.2.5