
Page 44 - text book form physics kssm 2020
P. 44
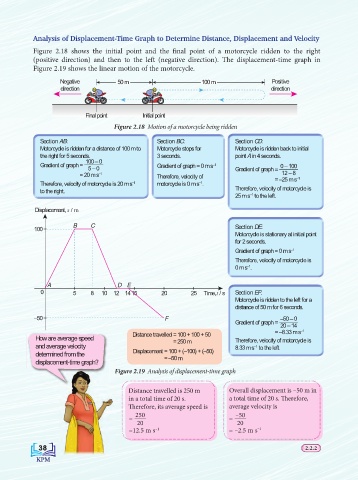
Analysis of Displacement-Time Graph to Determine Distance, Displacement and Velocity
                 Figure 2.18 shows the initial point and the final point of a motorcycle ridden to the right
                 (positive direction) and then to the left (negative direction). The displacement-time graph in
                 Figure 2.19 shows the linear motion of the motorcycle.
                         Negative         50 m                     100 m                 Positive
                         direction                                                      direction


                                Final point       Initial point

                                         Figure 2.18  Motion of a motorcycle being ridden
                   Section AB:                        Section BC:            Section CD:
                   Motorcycle is ridden for a distance of 100 m to   Motorcycle stops for   Motorcycle is ridden back to initial
                   the right for 5 seconds.           3 seconds.             point A in 4 seconds.
                                100 – 0
                   Gradient of graph   =              Gradient of graph = 0 m s –1         0 – 100
                                 5 – 0                                       Gradient of graph   =
                               = 20 m s –1                                                 12 – 8
                                                      Therefore, velocity of             = –25 m s –1
                   Therefore, velocity of motorcycle is 20 m s –1   motorcycle is 0 m s .
                                                                   –1
                   to the right.                                             Therefore, velocity of motorcycle is
                                                                                  –1
                                                                             25 m s  to the left.
                 Displacement, s / m
                             B    C                                          Section DE:
                 100
                                                                             Motorcycle is stationary at initial point
                                                                             for 2 seconds.
                                                                             Gradient of graph = 0 m s –1
                                                                             Therefore, velocity of motorcycle is
                                                                             0 m s .
                                                                                 –1
                     A                    D  E
                   0         5    8  10  12  14 15     20       25  Time, t / s  Section EF:
                                                                             Motorcycle is ridden to the left for a
                                                                             distance of 50 m for 6 seconds.

                 –50                                    F                                  –50 – 0
                                                                             Gradient of graph   =  20 – 14
                                                                                                 –1
                                               Distance travelled  = 100 + 100 + 50      = –8.33 m s
                 How are average speed                     = 250 m           Therefore, velocity of motorcycle is
                 and average velocity                                        8.33 m s to the left.
                                                                                   –1
                 determined from the             Displacement   = 100 + (–100) + (–50)
                                                        = –50 m
                 displacement-time graph?ment-time graph?
                                         Figure 2.19  Analysis of displacement-time graph
                                         F F
                                             Distance travelled is 250 m    Overall displacement is –50 m in
                                             in a total time of 20 s.       a total time of 20 s. Therefore,
                                             Therefore, its average speed is   average velocity is
                                                250                           –50
                                              =                             =
                                                20                            20
                                              =12.5 m s –1                  = –2.5 m s –1

                  38
                  38                                                                               2.2.2
                                                                                                   2.2.2