
Page 48 - text book form physics kssm 2020
P. 48
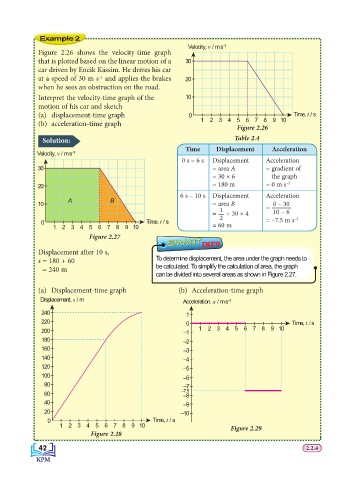
Example 2
                                                               Velocity, v / m s –1
                  Figure 2.26 shows the velocity-time graph
                  that is plotted based on the linear motion of a   30
                  car driven by Encik Kassim. He drives his car
                  at a speed of 30 m s  and applies the brakes   20
                                    –1
                  when he sees an obstruction on the road.
                  Interpret the velocity-time graph of the     10
                  motion of his car and sketch
                  (a) displacement-time graph                   0                              Time, t / s
                  (b) acceleration-time graph                      1  2  3  4  5  6  7  8  9 10
                                                                              Figure 2.26
                    Solution:                                                Table 2.4
                                                               Time     Displacement     Acceleration
                  Velocity, v / m s –1
                                                             0 s – 6 s  Displacement   Acceleration
                  30                                                   = area A        =  gradient of
                                                                       = 30 × 6         the graph
                  20                                                   = 180 m         = 0 m s –2
                                                             6 s – 10 s  Displacement  Acceleration
                           A            B
                  10                                                   = area B          0 – 30
                                                                         1             =
                                                                       = — × 30 × 4      10 – 6
                   0                               Time, t / s           2             = –7.5 m s –2
                       1  2  3  4  5  6  7  8  9 10                    = 60 m
                                                         SMART
                                                         SMART
                                  Figure 2.27
                                                                    INFO
                  Displacement after 10 s,
                  s = 180 + 60                        To determine displacement, the area under the graph needs to
                    = 240 m                           be calculated. To simplify the calculation of area, the graph
                                                      can be divided into several areas as shown in Figure 2.27.

                  (a) Displacement-time graph               (b) Acceleration-time graph
                   Displacement, s / m                        Acceleration, a / m s –2

                   240                                         1
                   220                                         0                               Time, t / s
                   200                                        –1   1  2  3  4  5  6  7  8  9 10
                   180                                        –2
                   160                                        –3
                   140                                        –4
                   120                                        –5
                   100                                        –6
                    80                                        –7
                    60                                       –7.5
                                                              –8
                    40                                        –9
                    20                                       –10
                     0                               Time, t / s
                         1  2  3  4  5  6  7  8  9 10
                                                                            Figure 2.29
                                  Figure 2.28
                  42                                                                               2.2.4
                  42
                                                                                                   2.2.4