
Page 10 - Geelong business trends 2017_digital_Neat
P. 10
Percentage of sales generated each year. Sales and purchasing
2014 2015 2016 2017 performance
Geelong 60.0 59.3 62.9 60.9 There appears to be a minor shift
towards making sales beyond
Melbourne 18.8 19.2 18.7 14.0 the local areas of Geelong and
Rest of Victoria 8.2 9.8 9.7 12.8 Melbourne. In 2014, 21% of sales
Rest of Australia 8.9 7.9 7.4 9.1 were made outside these areas,
and this proportion has now risen
Overseas 4.1 3.8 1.3 3.3 to 25% in 2017, although there
was a decrease in sales to the
major market of Melbourne.
Percentage of goods and services purchased each year.
2014 2015 2016 2017 On average for all years,
Geelong 47.2 52.5 48.3 48.1 approximately 49% of goods
Melbourne 25.2 25.9 26.4 26.4 and services are purchased
Rest of Victoria 4.7 3.4 4.7 6.0 from the Geelong region. This
has remained fairly consistent,
Rest of Australia 13.7 10.7 14.4 12.8 but was higher in 2015. The
Overseas 9.4 7.5 6.3 5.7 proportion of goods and services
purchased from overseas has
been on a downward trend, from
9% in 2014 to 6% this year.
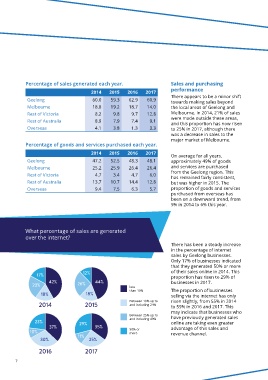
What percentage of sales are generated
over the internet?
There has been a steady increase
in the percentage of internet
sales by Geelong businesses.
Only 17% of businesses indicated
that they generated 50% or more
of their sales online in 2014. This
proportion has risen to 29% of
businesses in 2017.
less
than 10% The proportion of businesses
selling via the internet has only
Between 10% up to risen slightly, from 55% in 2014
and including 24% to 59% in 2016 and 2017. This
may indicate that businesses who
Between 25% up to
and including 49% have previously generated sales
online are taking even greater
50% or advantage of this sales and
more revenue channel.
7