
Page 23 - FROUTONEA_UK_21-22
P. 23
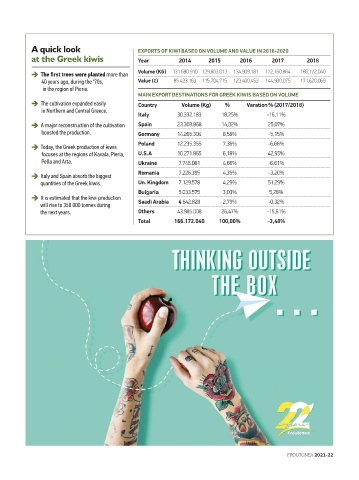
A quick look                        EXPORTS OF KIWI BASED ON VOLUME AND VALUE IN 2016-2020
           at the Greek kiwis                  Year         2014      2015       2016      2017        2018

           ➔   The first trees were planted more than   Volume (KG)  131.680.910  129.603.013  134.909.181   172.160.864   166.172.040
                    40 years ago, during the ‘70s,   Value (€)   85.423.163  115.704.715  123.400.453   144.930.075   171.620.069
                     in the region of Pieria.
                                               MAIN EXPORT DESTINATIONS FOR GREEK KIWIS BASED ON VOLUME
           ➔   The cultivation expanded easily   Country     Volume (Kg)    %      Varation % (2017/2018)
                    in Northern and Central Greece.
                                               Italy        30.332.183    18,25%          -16,11%
           ➔   A major reconstruction of the cultivation   Spain  23.303.868  14,02%      25,07%
                    boosted the production.    Germany      14.265.304     8,58%          -5,15%
           ➔   Today, the Greek production of kiwis   Poland    12.235.355  7,36%         -6,66%
                    focuses at the regions of Kavala, Pieria,   U.S.A  10.271.865  6,18%  42,95%
                    Pella and Arta.            Ukraine      7.746.081      4,66%          -6,61%
           ➔   Italy and Spain absorb the biggest   Romania   7.226.395    4,35%          -3,20%
                   quantities of the Greek kiwis.  Un. Kingdom   7.129.578  4,29%         51,29%
                                               Bulgaria     5.033.575      3,03%          5,28%
           ➔   It is estimated that the kiwi production
                   will rise to 350.000 tonnes during   Saudi Arabia   4.642.828  2,79%   -0,32%
                   the next years.             Others       43.985.008    26,47%          -15,61%
                                               Total       166.172.040    100,00%         -3,48%


                                                                                                FROUTONEA 2021-22