
Page 12 - Human Environment Interface (3)
P. 12
Nanoparticle Behavior in Living Cells
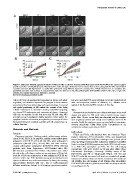
Figure 7. Dynasore inhibits uptake of COOH-PS NPs. (A) HEp-2 cells were incubated with fluorescent COOH-PS [YO] NPs in the absence (upper
panel) or presence of 130 mM dynasore. Representative confocal images of fluorescence in mid-nucleus sections along with the DIC channel were
acquired over time. (B) Experiments as in (A) were performed using different dynasore concentrations. Cellular fluorescence accumulation was
quantified over time from at least 15 measurements each. (C) Same as in (B) using yellow-green [YG] labelled COOH-PS NPs. Bars, 10 mm. min,
minutes; RFI, relative fluorescence intensity; s, seconds.
doi:10.1371/journal.pone.0062018.g007
cells is the basis of nanomaterial exposition in tissues and whole lots were used with FCS autocorrelation curves that could be fitted
organisms, and therefore important for progress in both research with one-component models of diffusion, e.g. diffusion times
areas, biomedical nanotechnology and nanotoxicology. Temporal typical of the fluorescent NPs exclusive of free dye.
and spatial positioning of NPs within the context of the living
cellular environment is essential to develop subcellular targeting, Tem
e.g. clinical NP applications and nanomaterial design. Consistent Nanoparticle stock solutions were diluted with water and a small
with this we describe for the first time that PS and silica NPs
generally act as monodisperse, highly dynamic entities within the aliquot was placed on 400 mesh carbon-coated formvar copper
cytoplasm and the cell nucleus, strengthening the concept of direct grids. After 10 min, excess fluid was discarded and the samples
interactions between xenobiotic particles and cell components, e.g. were negatively stained with uranyl acetate (2%) in water for 30
cellular function. seconds. Finally the specimens were examined with a transmission
electron microscope CEM 902A (Zeiss Oberkochen) at an
Materials and Methods acceleration voltage amounting to 80 kV.
Particles Cell culture
Fluorescent particles: Carboxy-coated, yellow-orange polysty- HEp-2 and HeLa cells obtained from the American Tissue
rene (COOH-PS [YO], 50 nm) NPs, carboxy-coated yellow-green Culture Collection ATCC (Rockville, USA), and transformed
polystyrene (COOH-PS [YG], 50 nm) NPs, plain yellow-green mouse fibroblasts (NIH-3T3) from wild-type mice (a kind gift of
polystyrene (plain-PS [YG], 50 nm) NPs, and bulk carboxy- Zhao-Qi Wang, FLI Jena) were cultured in Dulbecco’s modified
coated, yellow-green polystyrene (COOH-PS [YG], 200 nm) Eagle’s medium (DMEM) supplemented with 10% fetal calf serum
particles were from Polysciences. FITC-labelled silica NPs in a 10% CO2 atmosphere at 37uC. For live cell imaging
(50 nm) were purchased from Kisker. All particles were added experiments, cells were seeded on 42 mm glass dishes (Saur
directly to the cell culture medium at concentrations of 25 mg/ml. Laborbedarf, Reutlingen, Germany). Viability assays of NP
Each lot of NPs was subjected to in vitro analysis by FCS for the (COOH-PS, plain-PS or silica)-loaded HEp-2, U-2 OS and
presence of free dye. FCS discriminates two (or more) fluorescent NIH-3T3 cells did not reveal cell death or retarded cell growth
species of different size in the same solution by fitting the resulting behavior [17,18] and data not shown. Consistent with unaltered
autocorrelation functions with one-, two or multi-component cell viability, live cell imaging of cell division after intracellular
diffusion models (see below). In all imaging experiments particle COOH-PS NP-wash in appeared normal with no delays in mitotic
events (Figure S1 A).
PLOS ONE | www.plosone.org 10 April 2013 | Volume 8 | Issue 4 | e62018