
Page 9 - Human Environment Interface (3)
P. 9
Nanoparticle Behavior in Living Cells
Autocorrelation curves from FCS measurements at room temperature in distilled water (DDW), phosphate-buffered saline (PBS), Dulbecco‘s modified
Eagle‘s medium (DMEM), in DMEM containing 10% fetal calf serum (DMEM/10% FBS), in undiluted FBS, as well as in the nucleoplasm and cytoplasm
of living HEp-2 cells. (D) The diffusion coefficients of EGFP, COOH-PS [YO] NPs and silica NPs in different solvents or compartments of living cells were
determined by FCS measurements. (E) The hydrodynamic radii of EGFP, COOH-PS [YO] NPs and silica NPs were determined in different solvents or
compartments of living cells from the respective diffusion coefficients obtained by FCS. (F) Representative count rate trace of an FCS measurement of
COOH-PS [YO] NPs in the nucleus. BF, background fluorescence; kHz, kilo Hertz; PF, particle fluorescence. (G) Representative count rate trace of an
FCS measurement of COOH-PS [YO] NPs in the cytoplasm. CRP, count rate peaks. (H) The number of CRPs during 5 minutes FCS measurements was
quantified from count rate traces within the indicated solvents or cellular compartments. Cyto, cytoplasm; D, diffusion coefficient; NPs, nanoparticles;
nucleo, nucleoplasm.
doi:10.1371/journal.pone.0062018.g004
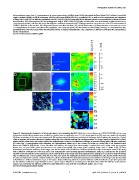
Figure 5. Nanoparticle dynamics in living cells and in vitro assessed by RICS. (A) A time series of fluorescent COOH-PS [YO] NPs that at room
temperature freely diffuse in water was acquired by confocal microscopy (frame size: 5126512 pixels; pixel size: 0.03 mm; scan speed: 6.4 ms/pixel).
(A) shows one image of the time series image stack. (B) Two-dimensional spatial autocorrelation of the image stack displaying the region for 32 pixel
shifts in negative and positive directions. Numbers along the color code bar indicate the correlation values. (C) Using a region of interest (ROI, 64x64
pixels) analysis, which scans sub-regions within the original image, a map for the diffusion coefficient is generated along with a diffusion coefficient
(D) color map. A corresponding scale indicating the hydrodynamic radius (rH) is also shown. (D) Image of a living HEp-2 cell incubated with
fluorescent COOH-PS [YO] NPs for 1 hour. The white box indicates the region were subsequently a confocal time series image stack was acquired
(frame size: 5126512 pixels; pixel size: 0.03 mm; scan speed: 6.4 ms/pixel). One image of the resulting image stack is shown in (E). (F) Two-
dimensional spatial autocorrelation of the image stack (as described in B). (G) Diffusion coefficient distribution map of the region shown in (E) along
with a diffusion coefficient (D) color map and a scale indicating the corresponding apparent hydrodynamic radius (rH) corrected for the apparent
viscosity of 30 nm particles in the nucleus [52]. (H) A confocal time series image stack was acquired in the cytoplasm of a COOH-PS [YO] NP-treated
HEp-2 cell (frame size: 5126512 pixels; pixel size: 0.03 mm; scan speed: 6.4 ms/pixel). One image of the resulting time series stack is shown. Note that
the selected region also contains a region outside the cell (m, medium). (I) Two-dimensional spatial autocorrelation of the image stack (as described
in B). Diffusion coefficient distribution maps of the region shown in (H) along with the respective diffusion coefficient (D) color maps were generated
for the diffusion coefficient ranges between 0 and 2.7 mm2s-1 (J), or between 0 and 0.48 mm2s-1 (K). Black areas within the diffusion maps indicate
regions not covered by the diffusion coefficient range displayed or areas with fits of insufficient quality. Bar, 10 mm.
doi:10.1371/journal.pone.0062018.g005
PLOS ONE | www.plosone.org 7 April 2013 | Volume 8 | Issue 4 | e62018