
Page 7 - Human Environment Interface (3)
P. 7
Nanoparticle Behavior in Living Cells
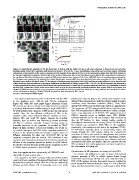
Figure 3. Quantitative analysis of PS NP dynamics in living cells by FRAP. (A) HEp-2 cells were subjected to fluorescence recovery after
photobleaching (FRAP) after incubation with fluorescent plain-PS [YG] NPs for 1 hour. Quantification was performed in circular regions containing
cytoplasmic vesicles (green), at the nuclear envelope (red; micrograph of two adjacent cells), or in the nucleoplasm (blue). Note that FRAP analyses in
the nucleus required increasing the detector gain of the confocal microscope due to the lower fluorescence signal in this compartment compared to
the cytoplasm. Therefore the fluorescence signals in FRAP images appear over-saturated. Bars, 10 mm. (B) FRAP curves from independent experiments
(n = 10) were then quantitated by plotting the relative fluorescence intensity (RFI) over time (graphs). Data were normalized to RFI = 1 within the
bleached region before the bleach pulse. (C) The amount of slowly moving (interacting) NPs (Fslow) and their recovery halftime (t50%) at the indicated
cellular structures were determined as described in Materials and Methods. (D) Whole nucleus FRAP. COOH-PS [YO] NP-fluorescence was bleached in
a region containing the whole nucleus (dotted green line) and fluorescence recovery into the nucleus monitored over time. (E) Quantitation of whole
nucleus FRAP experiments. Graph shows mean values from at least ten measurements (standard deviations were below 16% of mean values, not
shown). (E) FRAP data were fitted to a two-component exponential function (red graph) from which the recovery halftimes and the relative fractions
of fast and slowly exchanging COOH-PS [YO] NP populations were determined. Bars, 10 mm.
doi:10.1371/journal.pone.0062018.g003
The apparent hydrodynamic radii of COOH-PS and silica NPs (CRPs) were observed (Figure 4G, arrow). Such singular events
in the cytoplasm were ,300 nm and 150 nm, respectively during FCS measurements are indicative of large mobile structures
(Figure 4E). While this result might suggest formation of large containing many fluorescent molecules [40,41]. Thus, CRPs
NP clusters, we did not observe such large clusters by confocal during FCS of NPs may represent large clusters or agglomerates.
microscopy that otherwise enables imaging of single, bulk COOH- The occurrence of CRPs was quantified from at least three long-
PS [YG] particles with a diameter of 200 nm (see also subsequent time FCS measurements in different solvents or cellular compart-
results). Thus, the low diffusion coefficients of NPs in the ments. Low propensity of COOH-PS NP agglomeration (,2
cytoplasm rather reflect additional diffusion inhibition of mono- CRPs/5 minutes) occurs in distilled water, PBS, DMEM,
disperse NPs and small NP clusters imposed by immobile DMEM/10%FBS, and the cell nucleus (Figure 4H) corroborating
obstacles, such as vesicles and filaments as shown previously that the NP-interface in these settings mainly consists of
[35–38]. In addition, unspecific transient binding events to monodisperse nanomaterials. An average of 6 or 12 CRPs within
immobile structures in the cytoplasm, as revealed by FRAP five minutes was counted in 100% FBS, or the cytoplasm,
(Figure 3) likely contribute to decreased mobility. Our results are respectively. It is important to note that in the cytoplasm COOH-
in excellent agreement with FCS studies employing similar-sized PS NP-loaded organelles (such as mitochondria, Figure S1)
dextran in the cytoplasm [37], and indicate a higher degree of moving through the FCS volume during the measurement
diffusion obstruction for silica and COOH-PS NPs in the contribute to CRPs, and cannot be distinguished from particle
cytoplasm compared with the nucleus. This conclusion is also agglomerates. Similar results concerning the distribution of CRPs
consistent with observations showing that the effective viscosity for in different intracellular compartments were obtained with silica
diffusion in the cytoplasm depends on particle size [39]. Indeed, and plain-PS NPs (data not shown). Thus, we conclude that the
the effective viscosity for larger particles in the cytoplasm can be 6 NPs investigated here rarely agglomerate into large complexes in
to 20-fold higher compared to water [35,36]. the environment of a living cell.
Very low agglomeration propensity of COOH-PS and Quantitation of NP dynamics in living cells by RICS
silica NPs in vitro and in vivo To measure fast (diffusion) as well as slower (interactions)
The majority of our FCS recordings of fluorescent NPs yielded dynamic processes of NPs in cellular systems Raster Image
count rate traces consisting of background fluorescence and signal Correlation Spectroscopy (RICS) was used complementary to
fluctuations by photons emitted from the freely (or obstructed) FCS. RICS analyses intensity fluctuations between neighboring
diffusing particles (Figure 4F). Occasionally, count rate peaks pixels by spatially autocorrelating the image in x and y direction
using two-dimensional fast Fourier transformation [23]. RICS
PLOS ONE | www.plosone.org 5 April 2013 | Volume 8 | Issue 4 | e62018