
Page 10 - Human Environment Interface (3)
P. 10
Nanoparticle Behavior in Living Cells
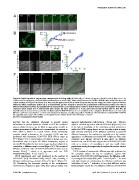
Figure 6. Rapid uptake of polystyrene nanoparticles in living cells. (A) Living HEp-2 cells were imaged to visualize particle fluorescence by
confocal microscopy (upper panel) and differential interference contrast (DIC, lower panel). Fluorescent COOH-PS [YO] NPs were added directly to the
culture medium at time point 0 seconds (0 s). Note, that the application of NPs is visualized by the distorted DIC image. (B) Circular regions of interest
within the diffuse cytoplasmic pattern (1) or at mitochondria (2) were selected to measure the accumulation of fluorescent particles over time at
different intracellular locations. (C) Quantification of measurements as described in (B) for COOH-PS [YO] NP fluorescence accumulation in the diffuse
cytoplasm (black graph) and at mitochondria (blue graph). (D) Same experiment as in (A), using fluorescently labelled plain-PS [YG] NPs. (E)
Quantification of measurements as described in (D) for plain-PS [YG] NP fluorescence accumulation in the cytoplasm. Relative fluorescence intensity
(RFI) in C and E was normalized to 1 at 0 seconds. (F) Same experiment as in (A), using bulk sized (200 nm diameter) fluorescently labelled COOH-PS
[YG] particles. Bars, 10 mm. NP, addition of nanoparticles; RFI, relative fluorescence intensity; s, seconds.
doi:10.1371/journal.pone.0062018.g006
therefore has the additional advantage to provide spatial apparent hydrodynamic radii between ,30 nm and ,200 nm,
again in excellent agreement with the FCS data (Figure 4E). Due
information of particle dynamics. Similar to FCS the measured to the lack of knowledge of the underlying nuclear architecture
within the RICS imaging frame, we are currently unable to assign
autocorrelation function can be fitted to appropriate models to with certainty variations of the diffusion coefficient to potential
diffusion barriers in the nucleus (i.e. nucleoli) or to the random
retrieve parameters for diffusion and concentration. In contrast to appearance of differently sized small NP complexes. Since such
variations were likewise observed in vitro, where no diffusion
FCS, which is limited to a small volume, RICS additionally barriers exist, our RICS data suggest that COOH-PS [YO] NPs
exist as a mixture of monodisperse and very small cluster
provides spatial information. As a control, RICS was first populations moving homogenously throughout the nuclear volume
by diffusion.
performed with fluorescent COOH-PS [YO] NPs in water at
25uC (Figure 5A). A representative correlation is shown as a one- RICS analysis of nanoparticle diffusion was also performed in
dimensional map in Figure 5B. When overlapping regions of the cytoplasm (Figure 5H–K). In cytoplasmic regions with
moderate COOH-PS [YO] NP-fluorescence, the diffusion coeffi-
interest (ROIs) within the time series image stack are subjected to cient ranged from below 0.05 mm2s21 and 0.5 mm2s21. In areas
with high density of mitochondria, the diffusion coefficient was
correlation, a diffusion map is created (Figure 5C). The measured well below 0.1 mm2s21, indicative of very slow diffusion and/or
binding (Figure 5J and K). The diffusion coefficient of COOH-PS
diffusion coefficient of the COOH-PS [YO] NPs in water was on
average 8 mm2s21, which is in agreement with our FCS
measurements (DFCS = 8.161.1 mm2s21).
RICS experiments were next performed in the nucleus of
COOH-PS [YO] NP-loaded living HEp-2 cells, revealing a
diffusion coefficient DRICS between 0.3 and 1.7 mm2s-1 (Figure 5D-
G). Considering the increased viscosity of the nucleoplasmic
environment compared to water [34], these values translate into
PLOS ONE | www.plosone.org 8 April 2013 | Volume 8 | Issue 4 | e62018